Dashboard
- 26 Sep 2024
- Print
- DarkLight
- Download PDF
Dashboard
- Updated on 26 Sep 2024
- Print
- DarkLight
- Download PDF
Article summary
Did you find this summary helpful?
Thank you for your feedback!
All your performance indicators on your home page
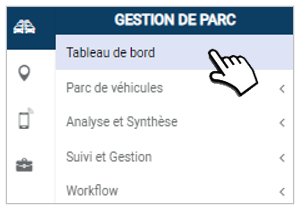
Your dashboard is made up of 7 tabs, detailed on the pages below:
- Fleet status and alerts tab
- Comparator tab
- Current fleet analysis tab
- Fleet evolution over the year and event breakdown tab
- TCO analysis tab
- TCO/CO2 trend tab
- TCM/CO2 tab
Tip
You can filter the display with 1 or more assignment centres. By default, the entire fleet is displayed.

1. FLEET STATUS AND ALERTS TAB
Statistics on your fleet and 9 clickable indicators showing you the details:
- Vehicles in fleet
- Running rules
- Renewal
- Consumption
- Average contracts
- Maintenance
- Incidents
- ANTAI (if option taken out)
- Cost price per kilometre
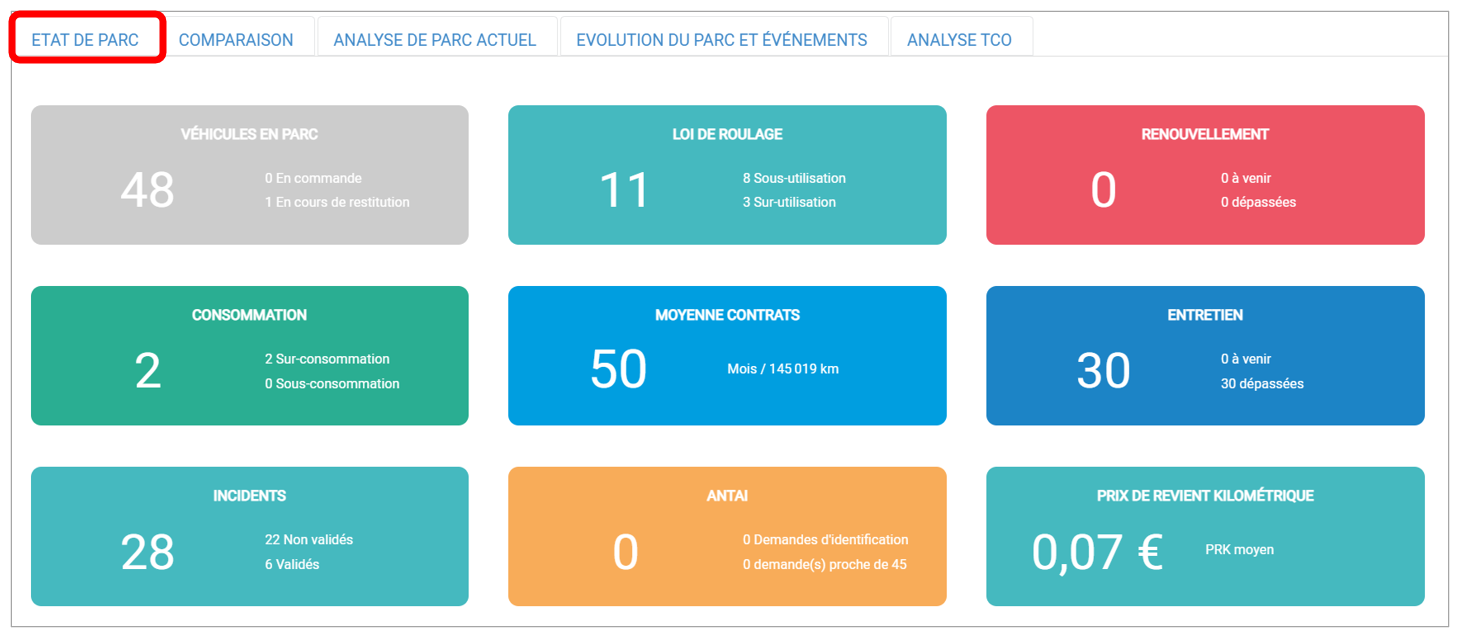
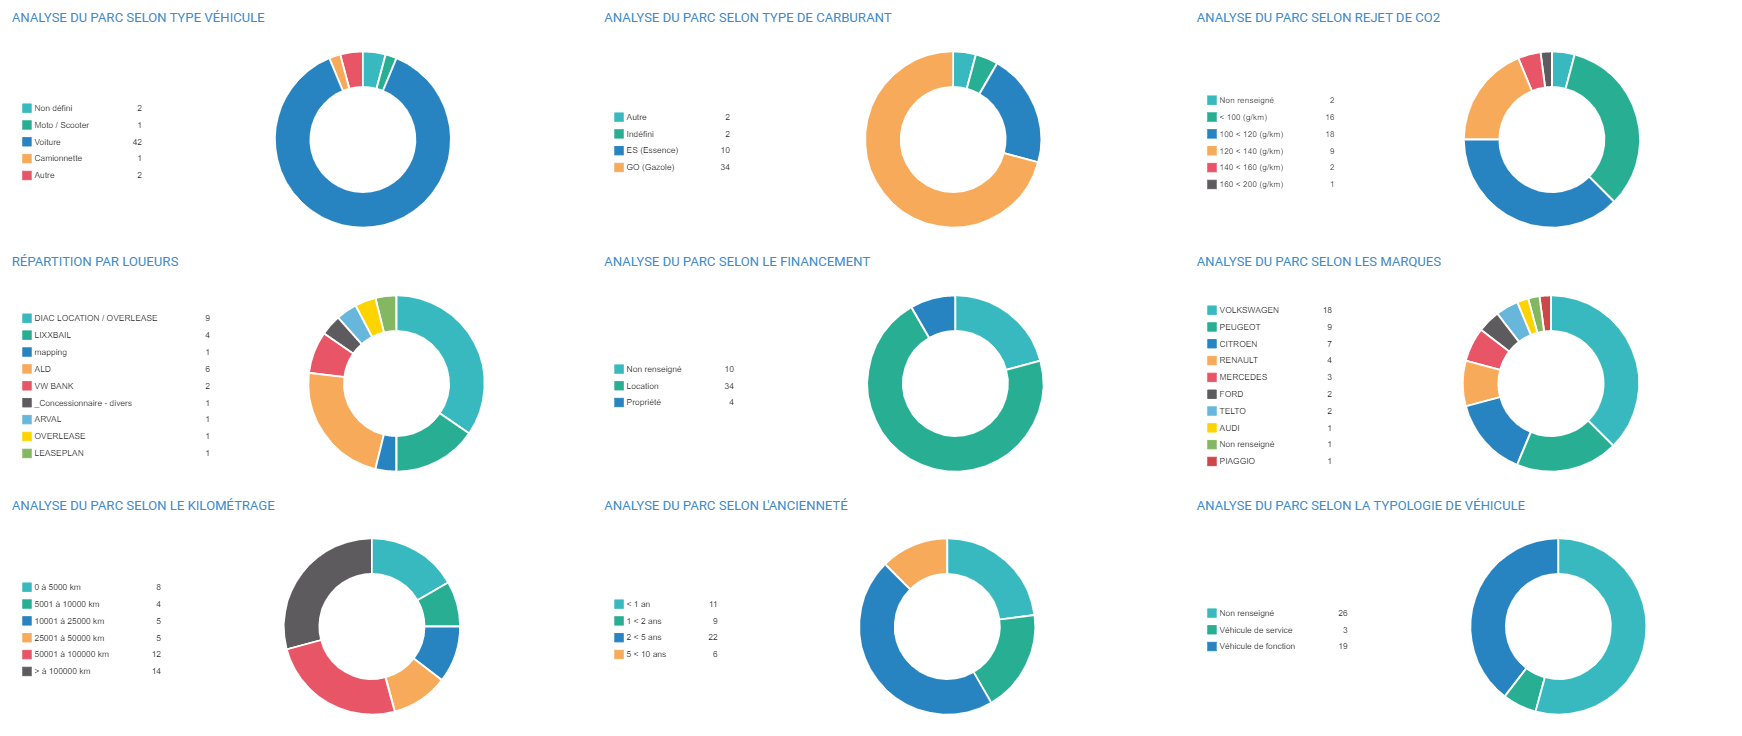
Analysis statistics are also displayed graphically on this page.
2. COMPARATOR TAB :
You can compare the performance of different driver/vehicle selections over the same period, or the same driver/vehicle selection over two different periods, on 5 criteria.
Steps to follow:
1. Select the periods to be compared.
2. Select the vehicles or drivers to be compared.
Note
Please note that the number of vehicles selected for a given period may differ due to changes in the vehicle fleet from one period to the next.
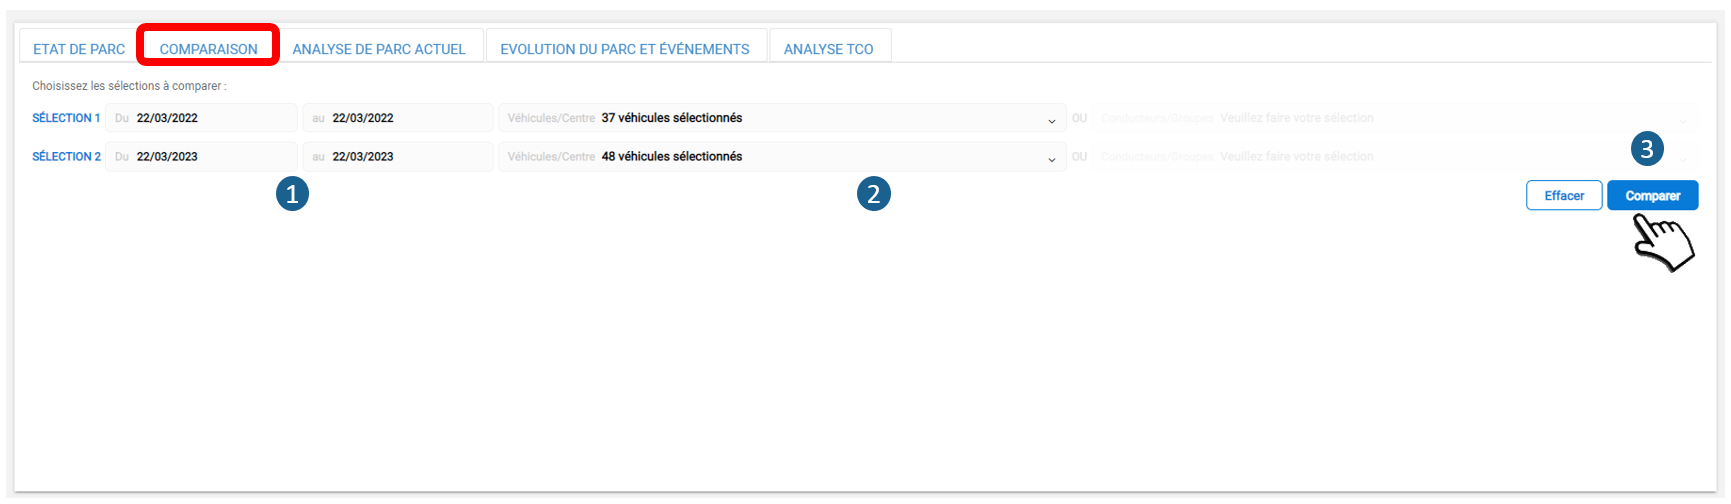
3. Cliquez sur COMPARER pour lancer l'analyse.
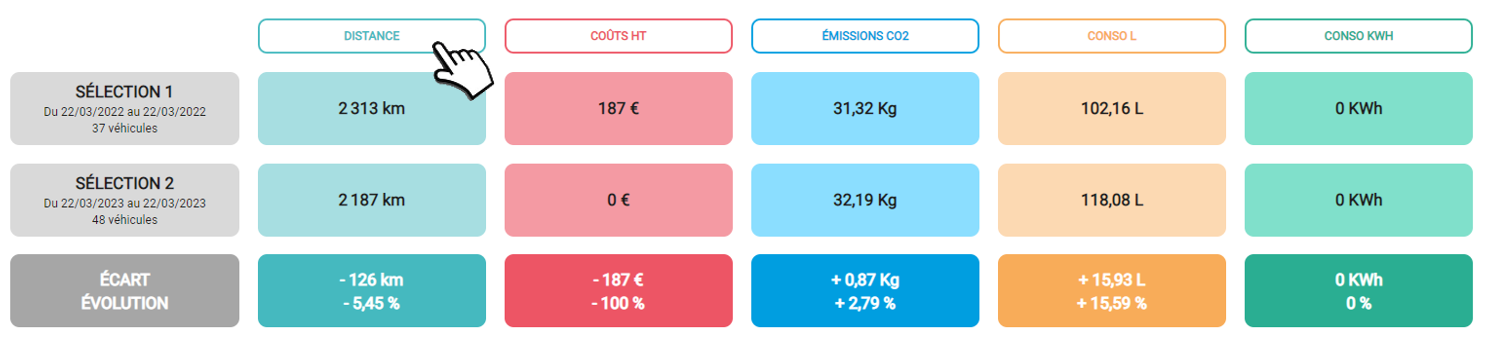
To view the comparative histogram, click on the column header.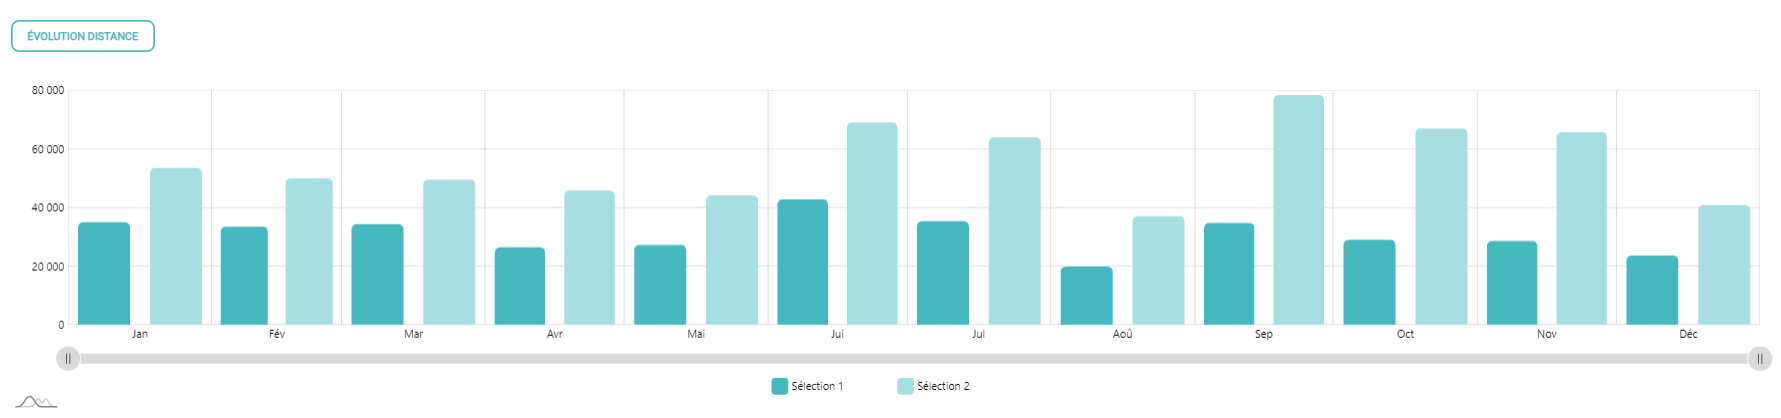
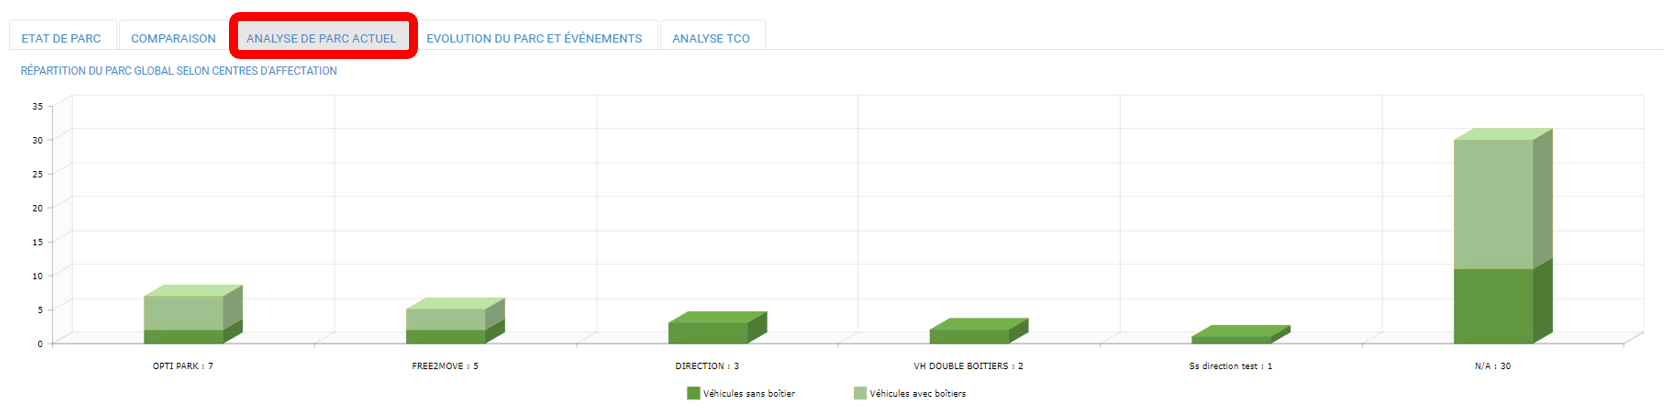
3. CURRENT FLEET ANALYSIS TAB:
Breakdown of the fleet according to assignment centres and whether or not it has a telematics box.
4. FLEET EVOLUTION OVER THE YEAR AND BREAKDOWN OF EVENTS:
Fines, interventions, incidents and alerts.

5. TCO ANALYSIS TAB:
Weight of TCO in relation to vehicle criteria (make, type, age, energy, management method, etc.)

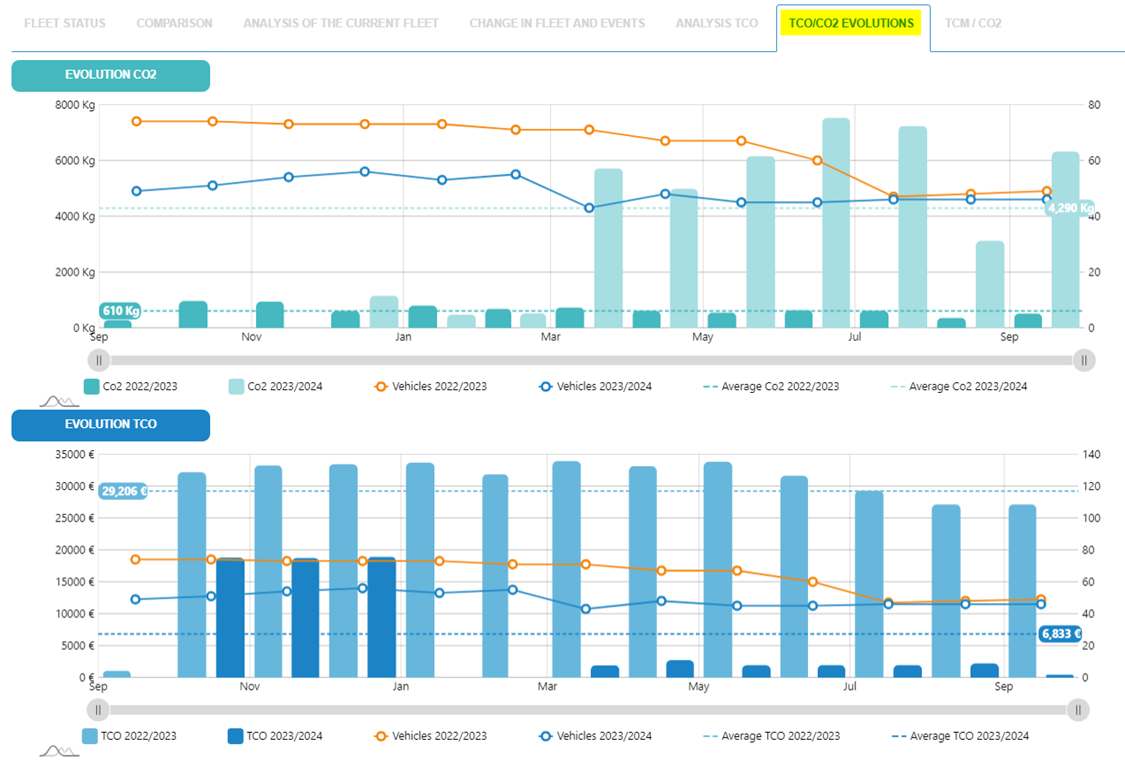
6. TCO/CO2 TRENDS TAB
This page shows changes in CO2 emissions and TCO over the last 12 rolling months compared with the last 12 months of the N-1 period. In the example below, the periods compared are September 2023 to September 2024 versus September 2022 to September 2023.
Each graph shows the monthly values, the annual average and the number of vehicles in the fleet.
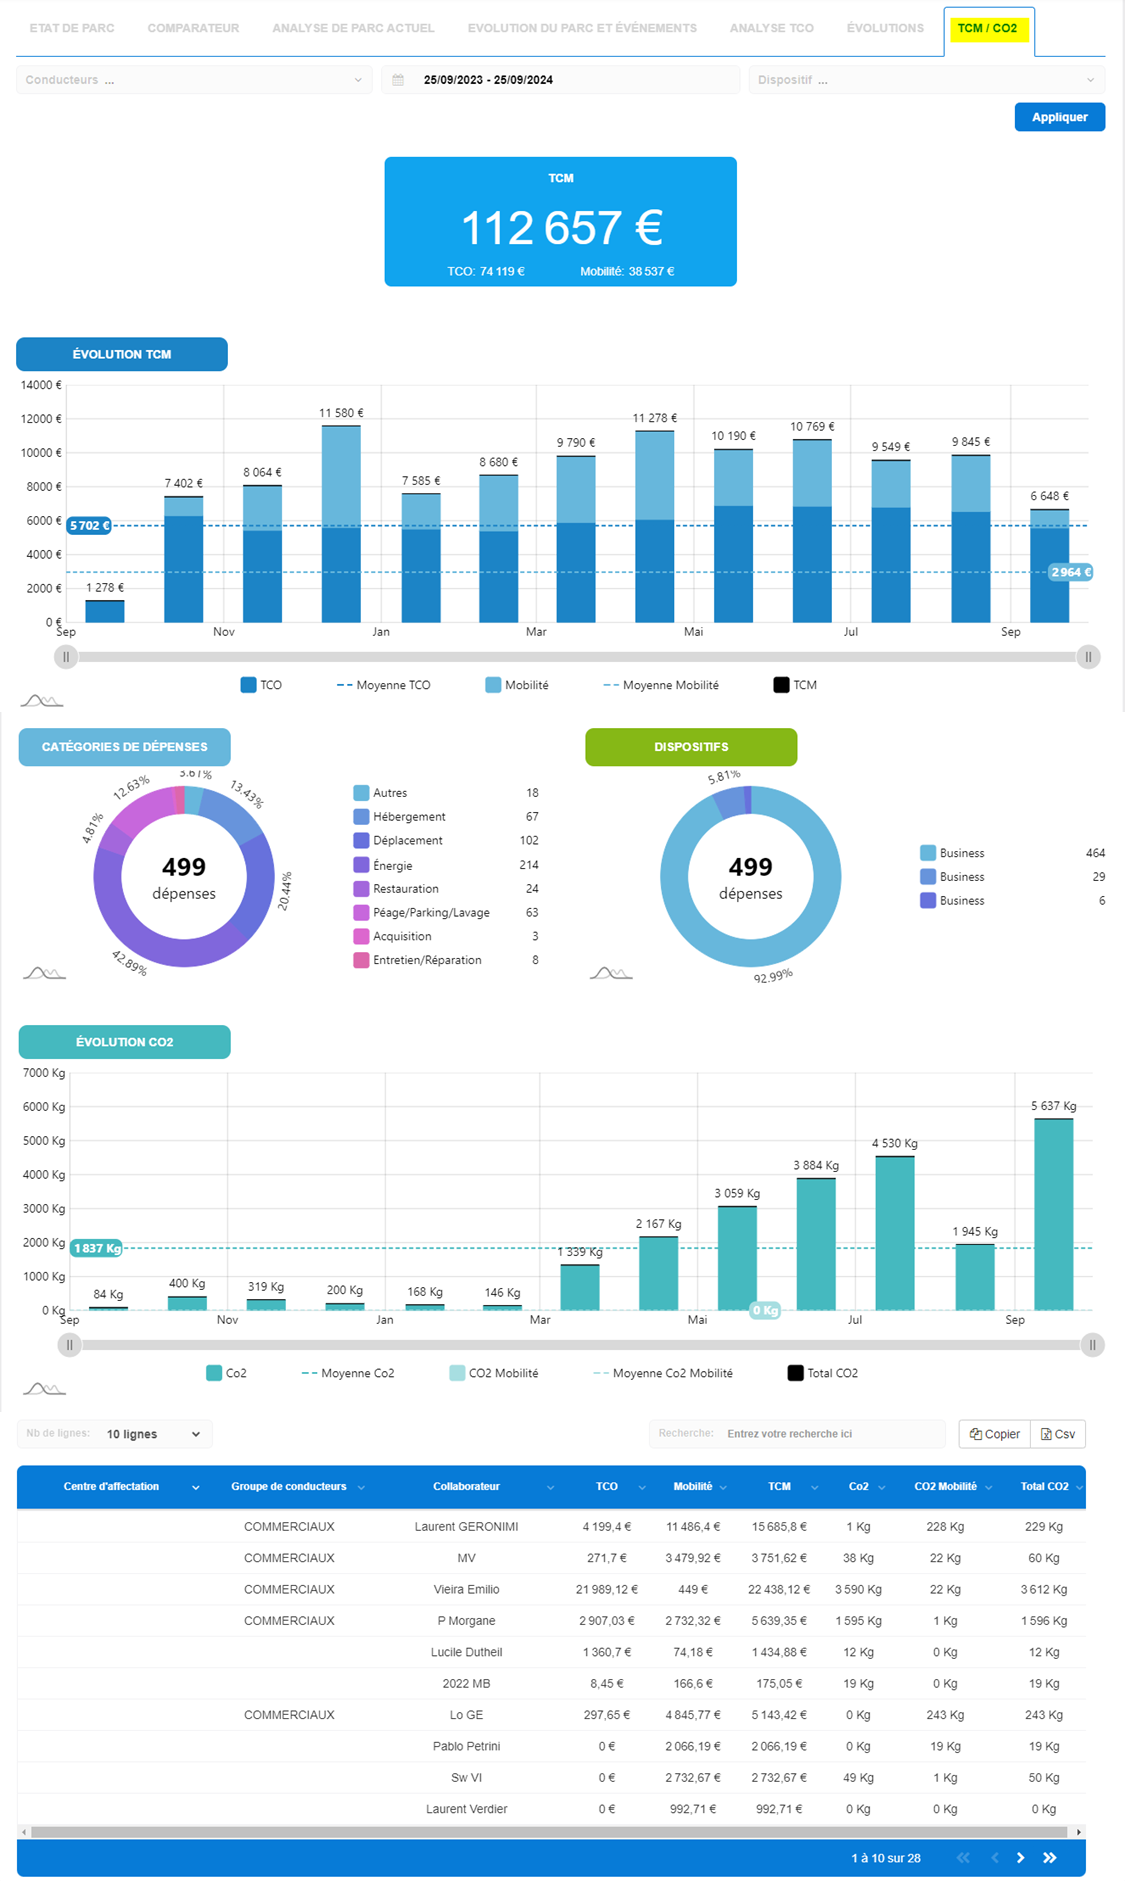
7. TCM/CO2 TAB
This page displays the company's TCO, its evolution over the last 12 months and the breakdown between TCO and other mobility expenses.
Expenses linked to other mobility are those incurred with Mobility Pack.
The page also displays :
- analysis of other mobility expenditure
- the evolution of the MCT's CO2 emissions, with the breakdown between TCO and other mobility expenditure
- a table of the expenses concerned
Was this article helpful?