Data analysis
- 30 Sep 2024
- Print
- DarkLight
- Download PDF
Data analysis
- Updated on 30 Sep 2024
- Print
- DarkLight
- Download PDF
Article summary
Did you find this summary helpful?
Thank you for your feedback!
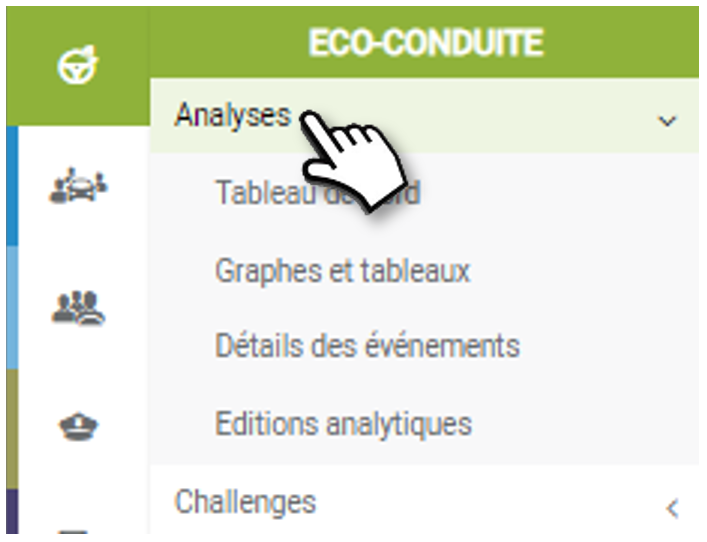
Dashboard
The Dashboard shows you your drivers' performance over the last 12 months.
It consists of 3 tabs:
- Performance
- Comparator
- Ranking
1. Driver performance
Overall results are displayed over the last 12 months for the entire fleet (all your drivers).
4 key indicators and detailed data on the side :
- Fuel savings
- CO2 emission savings
- Average consumption
- Financial savings
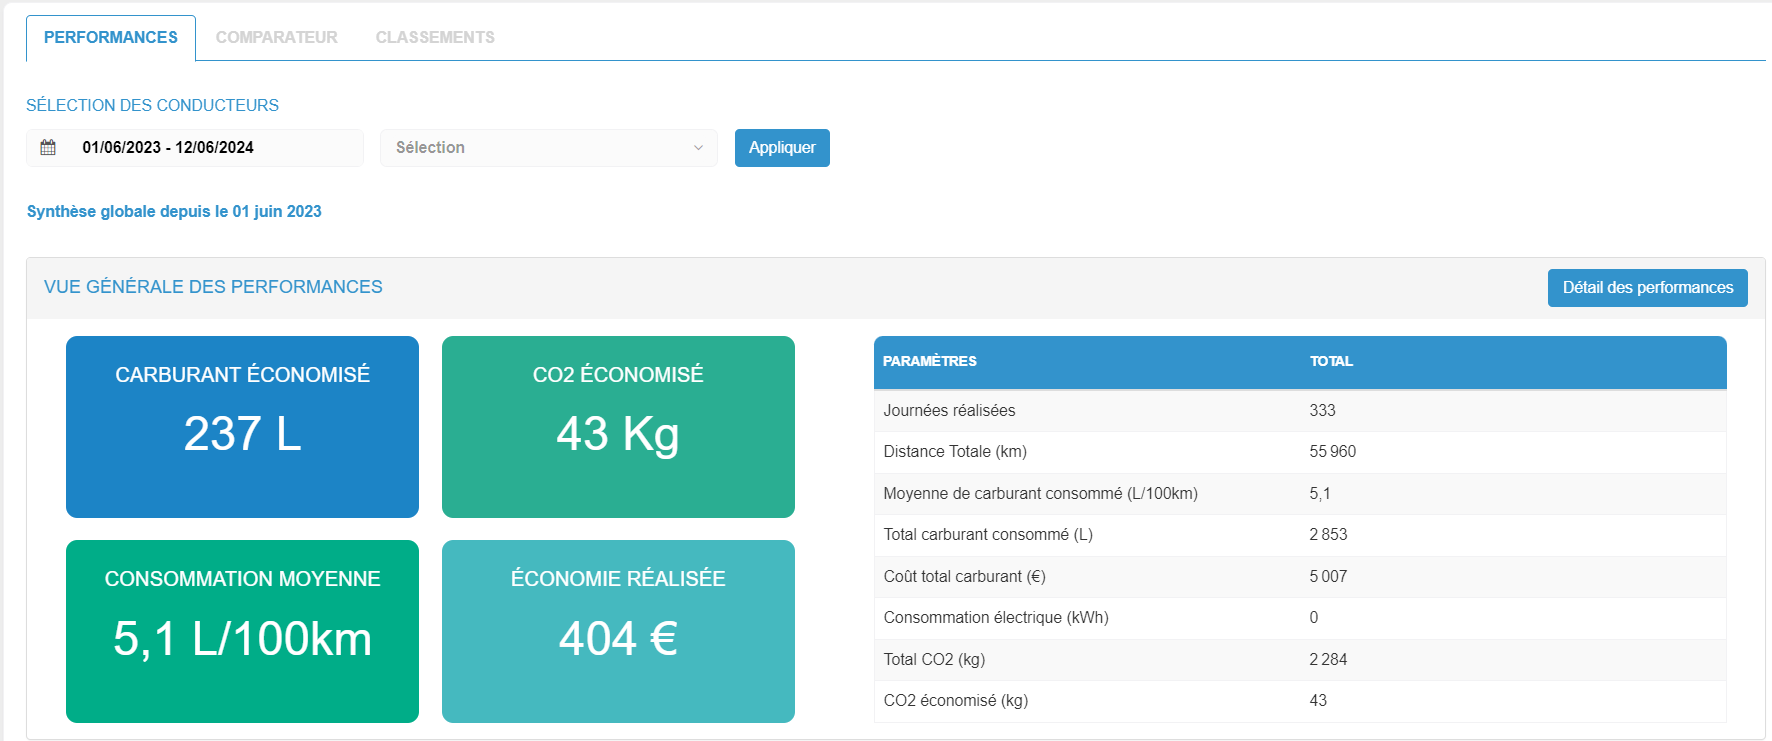
Driver selection” field: you can modify the selection by choosing certain drivers and/or groups and click on the APPLY button. The data will be updated.
Performance details” button: a window opens, displaying the complete list of selected drivers with performance details: eco-score, number of accelerations, hard braking, hard cornering, etc... You can export this file in .csv format.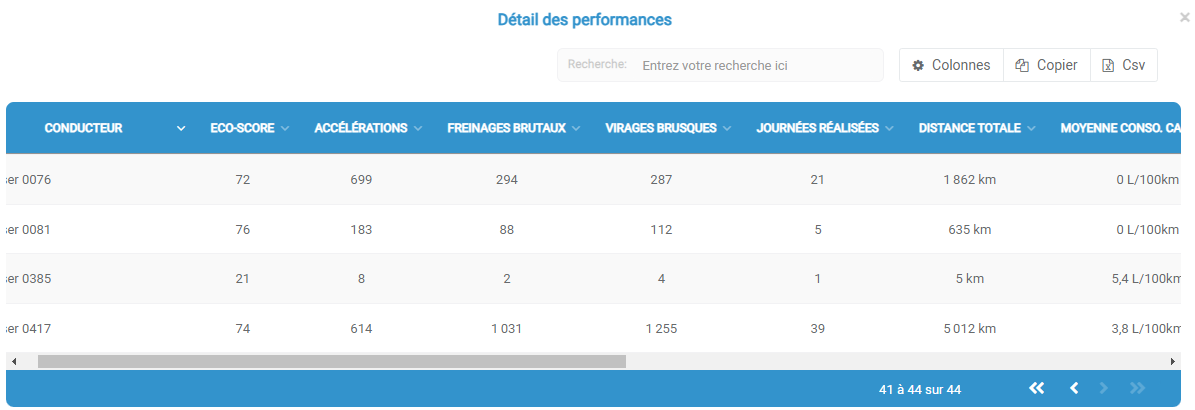 The eco-driving score evolution graph gives you an overall view of the score (for your selection of drivers).
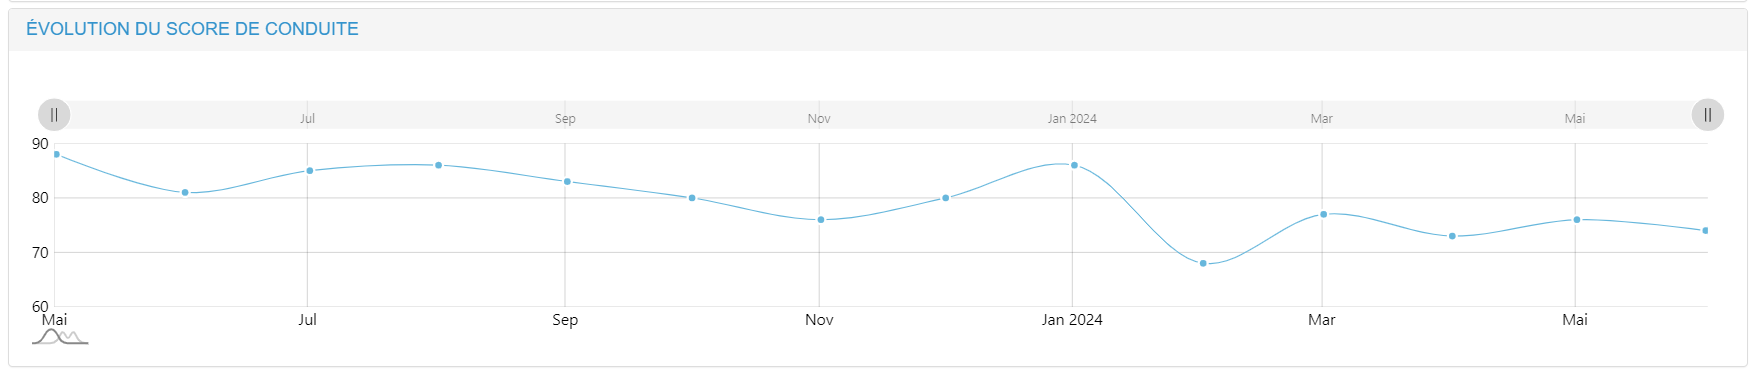
You can adjust it to zoom in on shorter periods.
2. Comparator
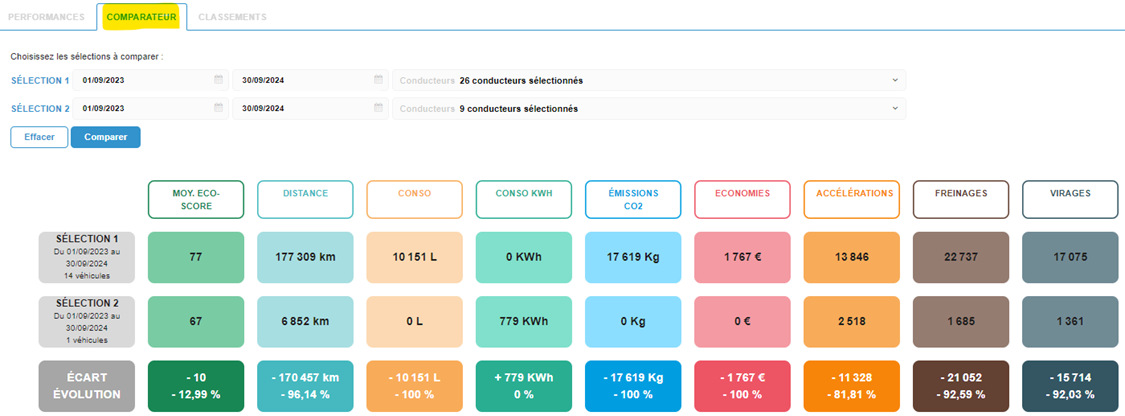 This comparator lets you compare the performance of 2 populations over the same period, or of one population over two different periods.Make your selection and click on COMPARE.
The system shows you the results on 9 criteria.
3. Rankings
This page shows your drivers' overall rankings, as well as the results of any challenges you've set up.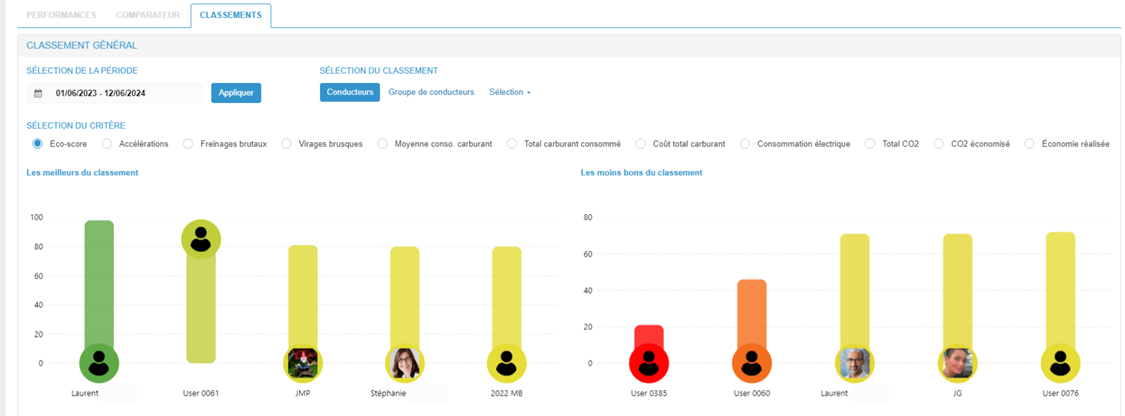 General ranking: once again, you can customize the period and population you wish to observe.
You can choose to see all drivers, or groups of drivers. You can compare according to 11 specific criteria.
Graphs highlight the best and worst drivers.
Charts and tables
View the statistics of your drivers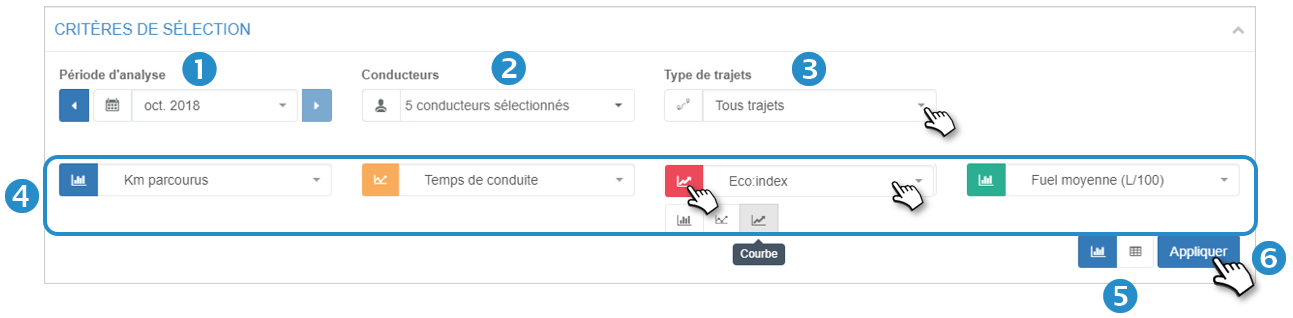
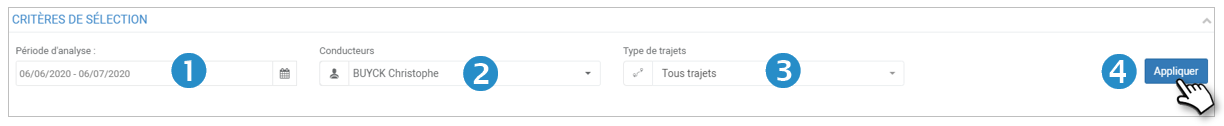
1. Select the analysis period.
2. Select the desired driver(s).
3. Select the type of trip.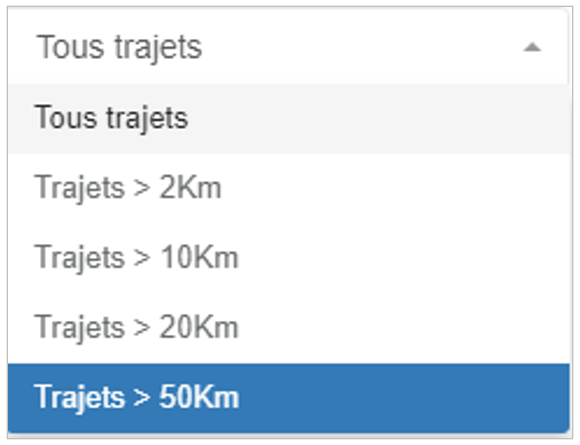
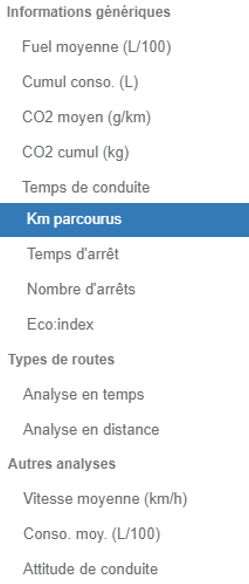
4. Select from 1 to 4 analysis criteria among the 14 proposed as well as the type of graph desired (bar, curve with mark, curve).
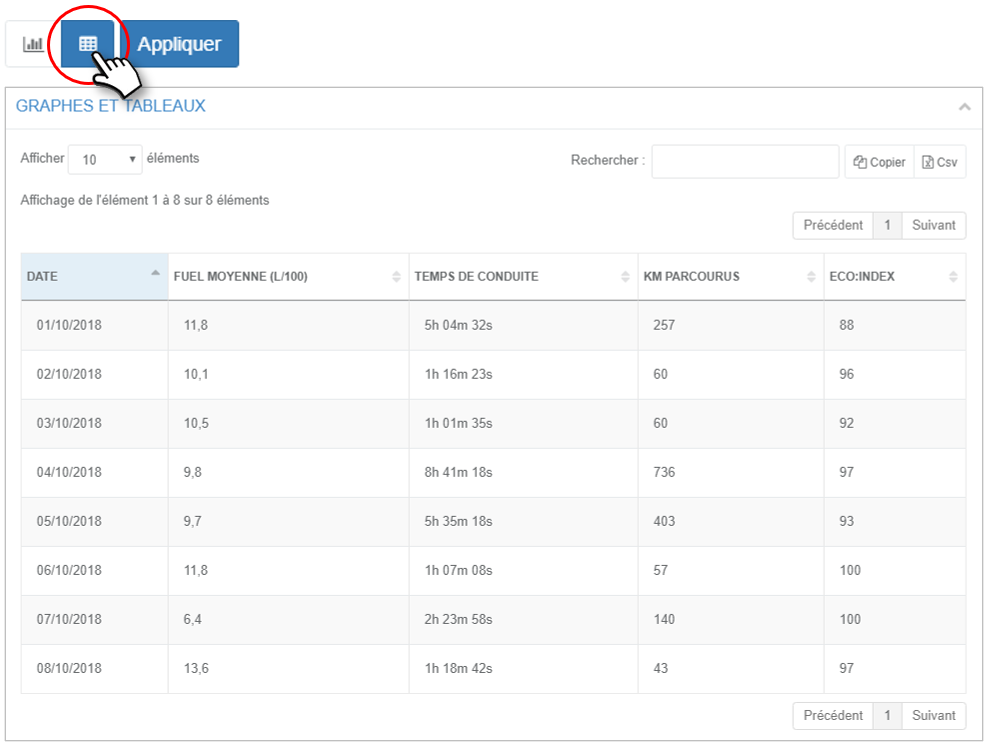
5. Select the type of display: chart or table.
Chart view:
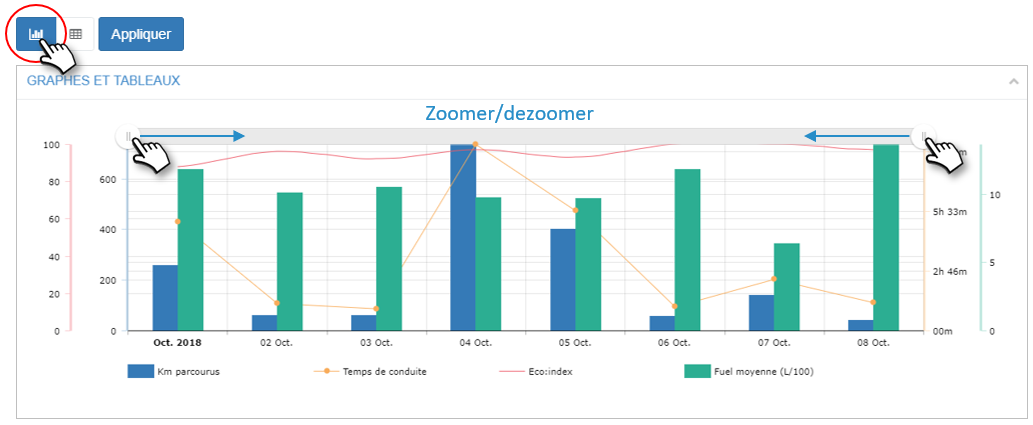
Table view:
6. Click on APPLY to display the result (see next page).
Event details
View a driver's trip details and driving data
1. Select the analysis period
2. Select the driver
3. Select the type of trips
4. Click on APPLY, the results will be displayed on the screen
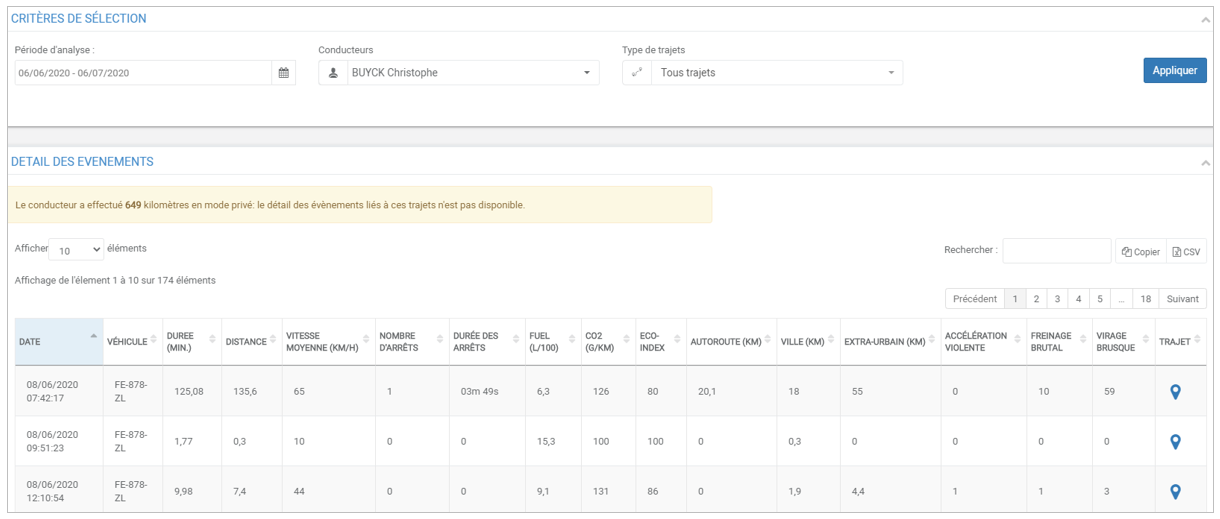
Informations
You can click on the arrows of a column to sort the content in ascending/descending order
You can copy the content of the table to paste it in another document or export it in .csv format
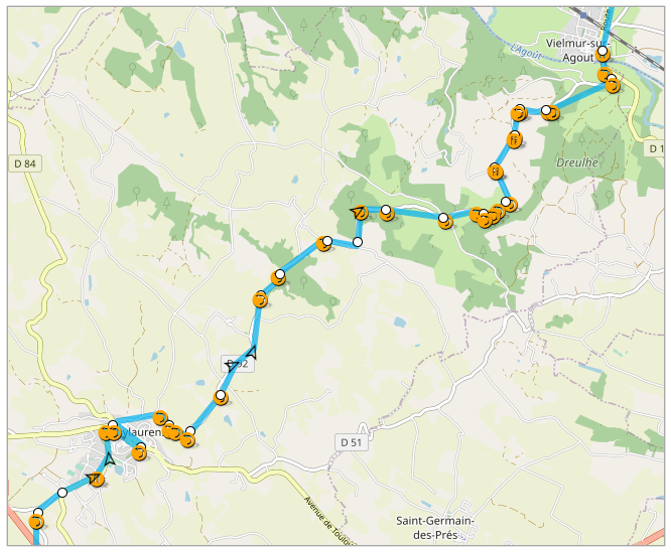
Click on  to see the routes and events (braking, acceleration, turns) on the map:
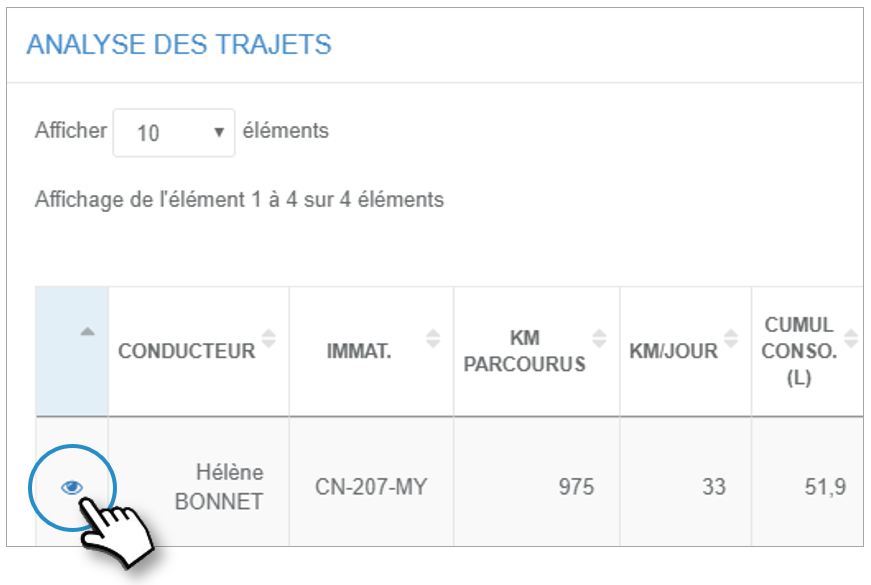
Analytical editions
Analysis of the trips of several drivers (multi-selection) and their driving data to (detail of the trips of a driver)
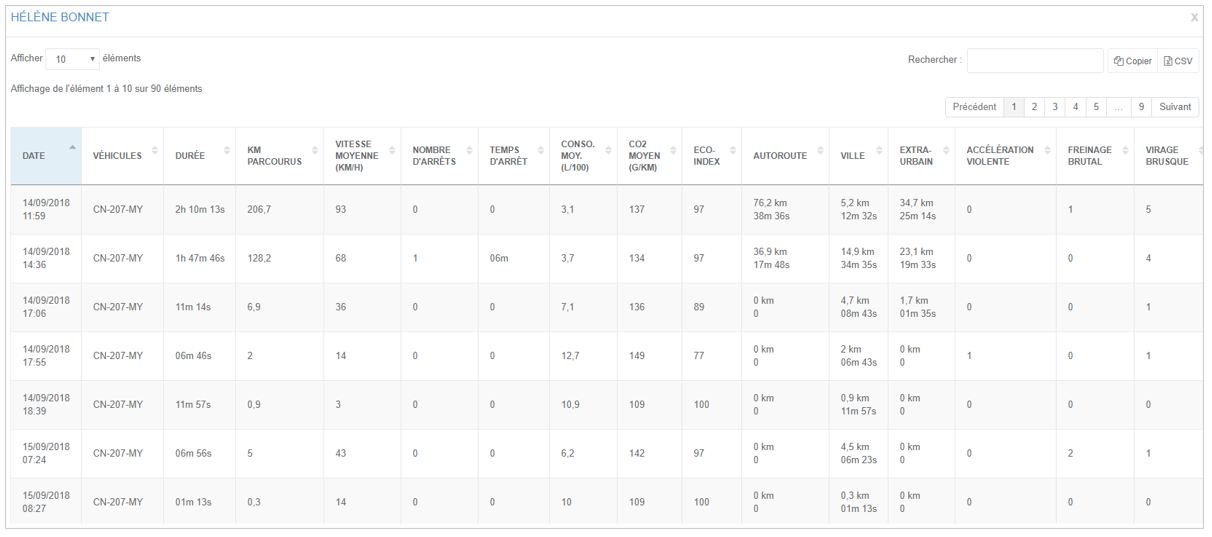
1. Click on the pictogram  at the beginning of the line to display the details of the trips:
2. The details of the trips are displayed in a window
Was this article helpful?