Electrification potential
- 25 Oct 2022
- Print
- DarkLight
- Download PDF
Electrification potential
- Updated on 25 Oct 2022
- Print
- DarkLight
- Download PDF
Article summary
Did you find this summary helpful?
Thank you for your feedback!
From this page you can get an overview of the electrification potential of your fleet.
Please note that this analysis is only first-level and uses only one axis to verify eligibility: time, distance, frequency of journeys.
It is then possible to go through our consulting services to obtain a more advanced analysis, which is based on several axes: time, frequency, distance of journeys, but also the presence or absence of charging stations on the journeys made, potential fuel savings achieved, or potential money losses caused by an investment in an electric vehicle that is greater than the savings achieved, etc.
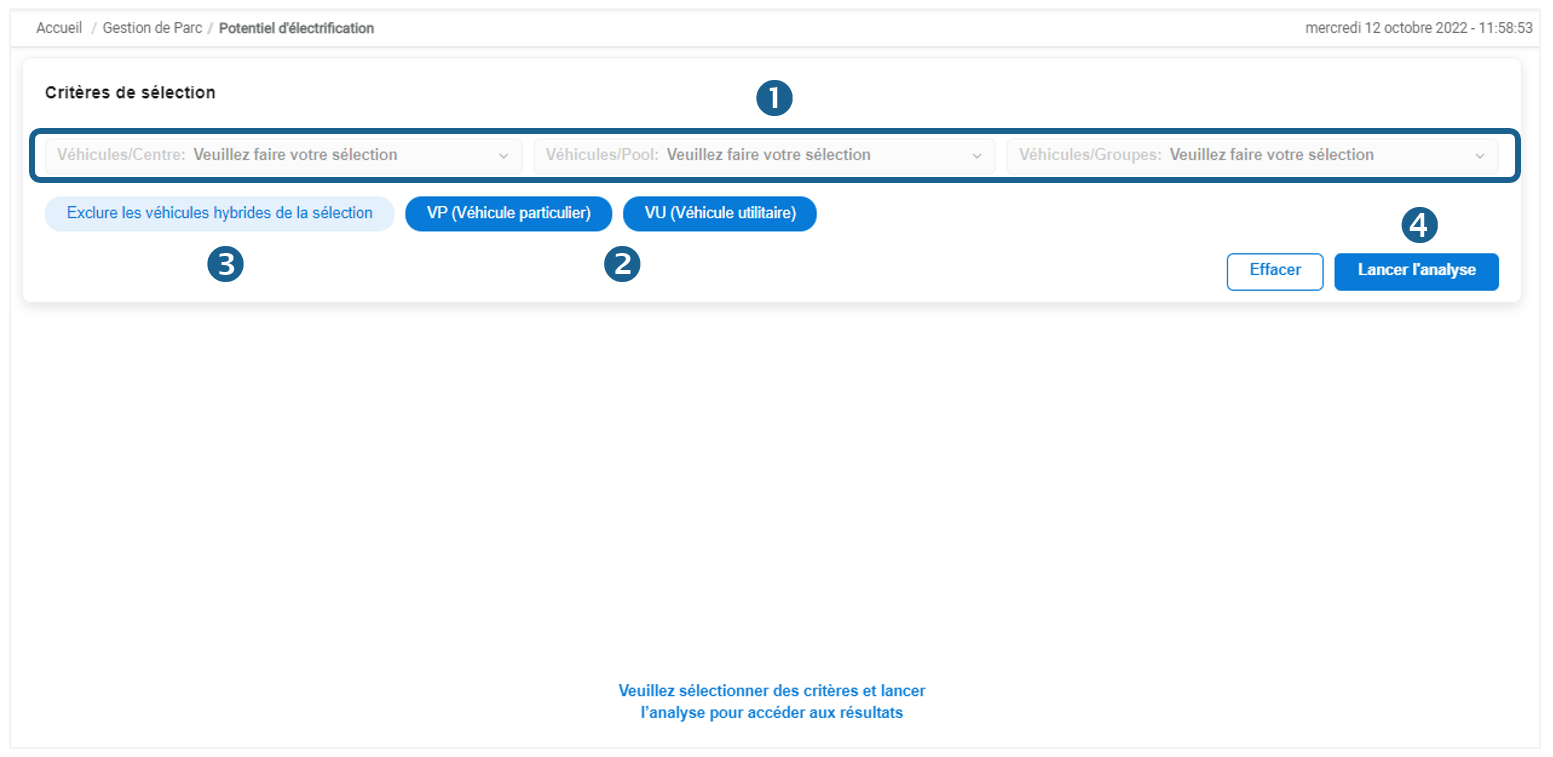
1. You have the option to select vehicles by center, pool or group or else leave the default selection.
2. By default passenger vehicles and commercial vehicles are included by default but you have the option to exclude them from the analysis.
3. If you want to exclude hybrid vehicles from the selection, click this button
4. Then click Start Analysis
After analysis, two sections are visible:
Electrification potential
In this part you will find a graph on which are distributed the electrifiable vehicles, electrifiable with certain routes not eligible, those priori not electrifiable and finally the vehicles with insufficient data.
This is only an analysis of electrification potential. For further analysis, click on the "Click here" button on the right.
You will then have the opportunity to obtain a thorough and exhaustive study of your fleet. It allows you to obtain a concrete electrification plan in terms of vehicles to be electrified, vehicles to be used in replacement, a recommendation of the number of charging stations, their power and location, the environmental and financial impact of electrification, etc.
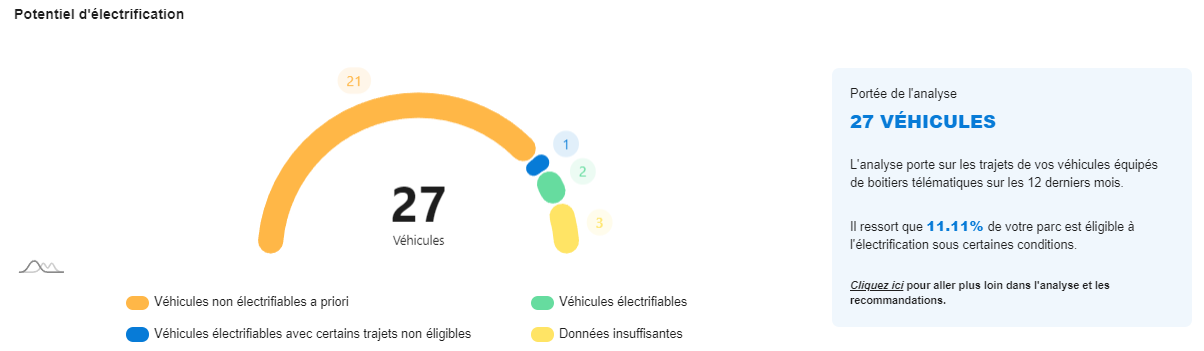
By clicking on the coloured parts of the graph, the affected vehicles are displayed/not displayed in the results table.
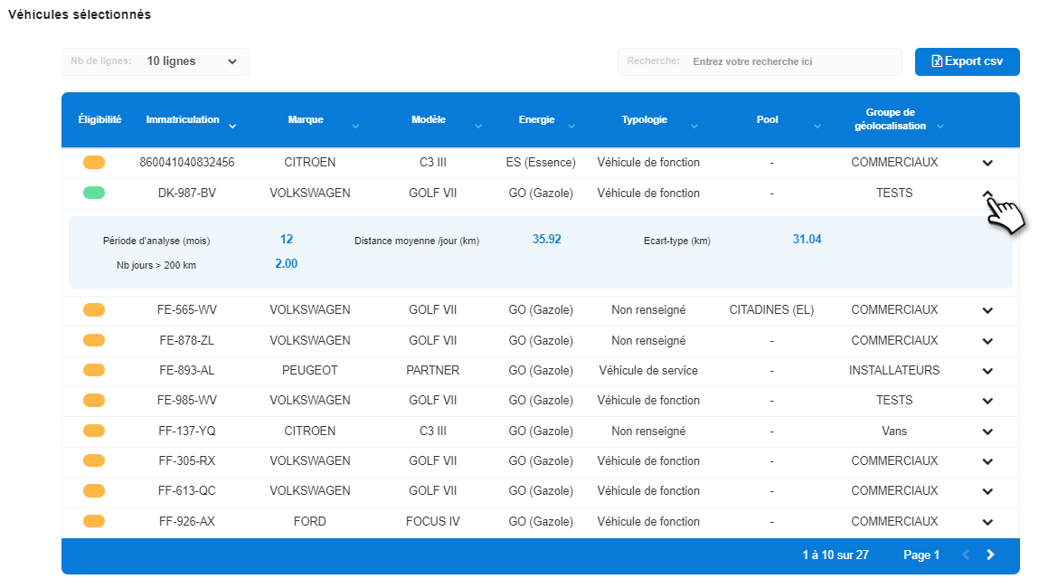
Selected vehicles
In this section you will find the list of vehicles selected for analysis. By clicking on the chevron at the end of the line, you can display additional information such as the analysis period, the average distance travelled per day, the standard deviation or the number of days on which the vehicle travelled more than 200 kilometres.
Was this article helpful?