Statistics
- 30 Sep 2021
- Print
- DarkLight
- Download PDF
Statistics
- Updated on 30 Sep 2021
- Print
- DarkLight
- Download PDF
Article summary
Did you find this summary helpful?
Thank you for your feedback!
View graphic fleet statistics
Selection criteria
By default, the application displays the statistics of ALL the vehicles whatever the management mode.
You can filter the display by :
1. Vehicle(s) or assignment center(s)
2. Management mode: rental, ownership, IK, leasing, credit....
3. Then click on APPLY
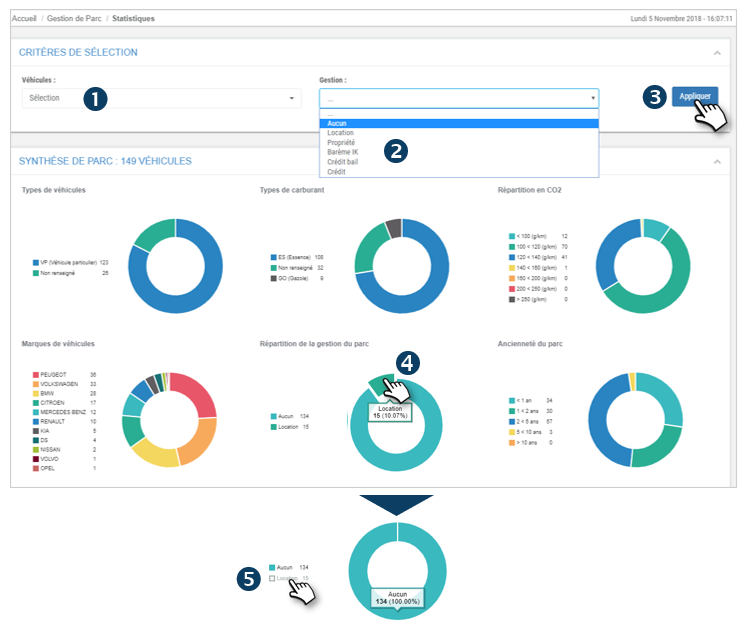
Park overview
Statistical charts are displayed in 6 categories.
4. Hover your cursor over any part of the graph to see its value and proportion.
On each graph :
5. You can click on an item in the legend to remove it from the statistics. The item is grayed out and the graph is adjusted without that item.
Click on the item again to make it reappear.
Was this article helpful?