Dashboard
- 31 Jan 2024
- Print
- DarkLight
- Download PDF
Dashboard
- Updated on 31 Jan 2024
- Print
- DarkLight
- Download PDF
Article summary
Did you find this summary helpful?
Thank you for your feedback!
Dashboard
From the side menu you can access the Dashboard. This page gives you a summary of the main indicators over different periods (1 month, 6 months, over a year). By sliding up the blue bar you can access the details of each chart.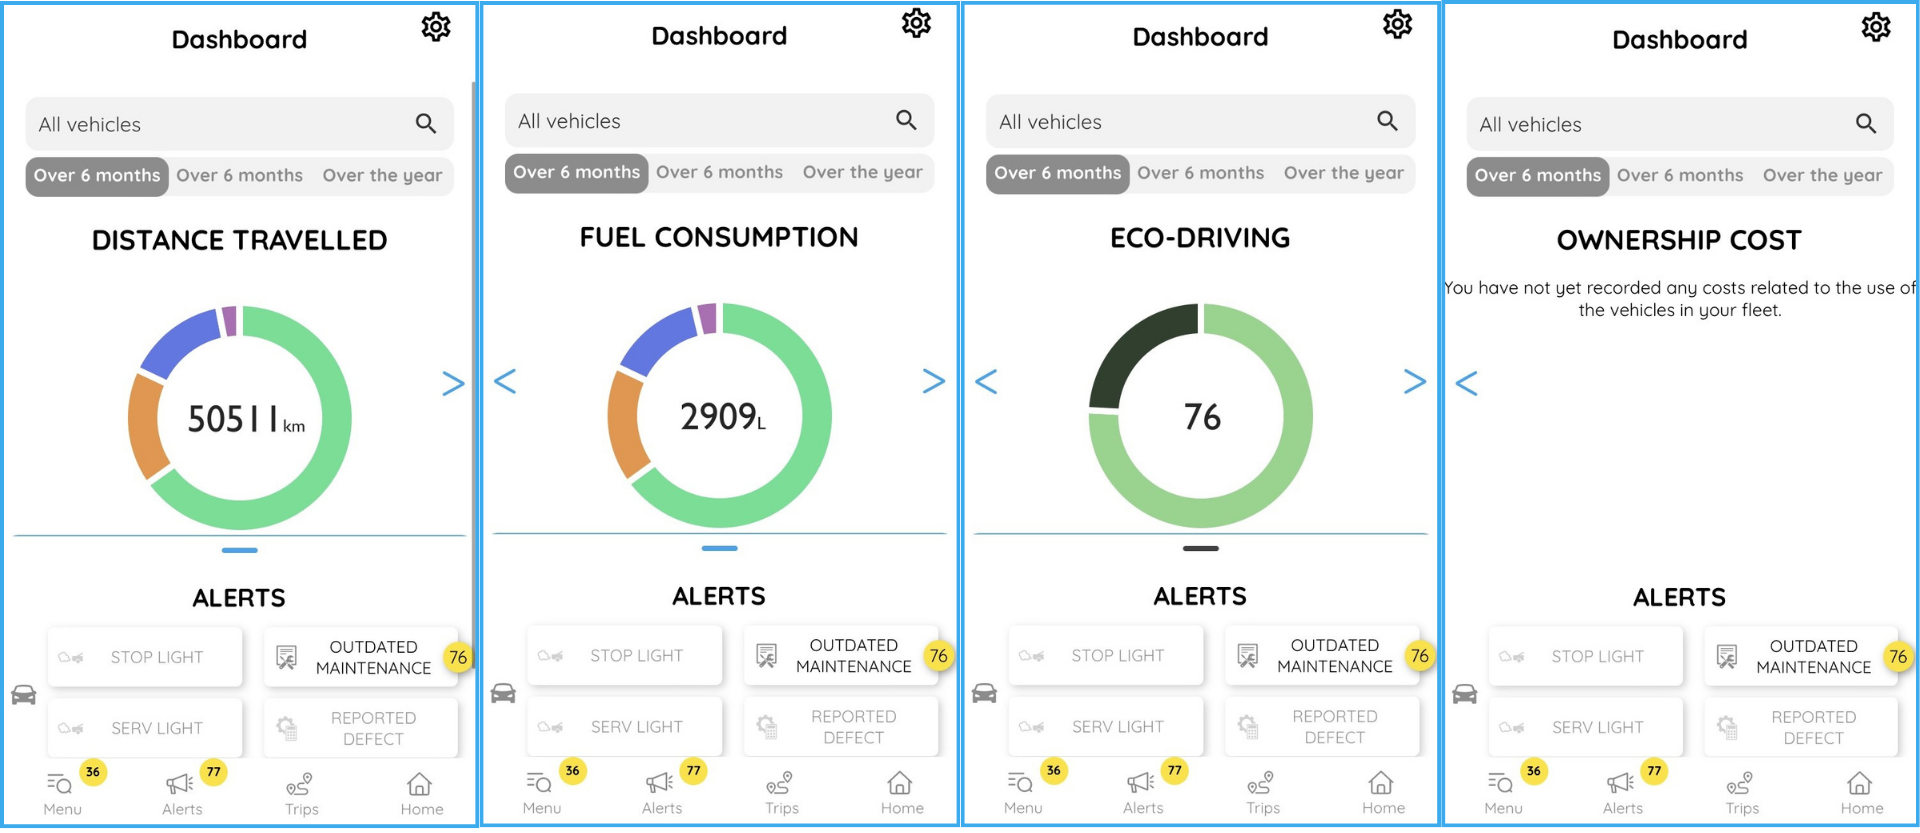
At the bottom of these graphs you will find direct links to the alerts that you have previously set up on the platform, with the list of vehicles affected by these alerts.
Was this article helpful?