- 30 Jan 2025
- Print
- DarkLight
- PDF
TCO and CPK
- Updated on 30 Jan 2025
- Print
- DarkLight
- PDF
Build and find TCO dashboards
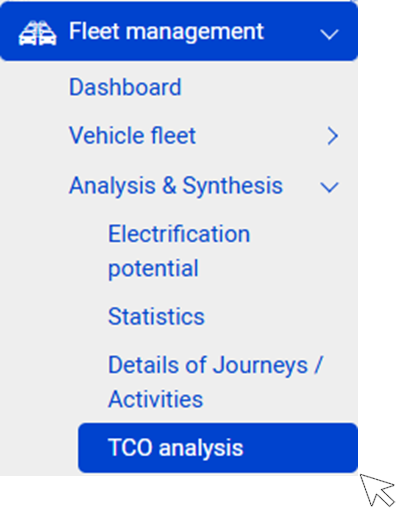
Principles
This section allows you to create TCO analysis dashboards according to your wishes and organization.
A dashboard is composed of an unlimited number of graphical analysis modules.
You can create as many dashboards as you wish.
You can include as many analysis modules as you wish within each dashboard.
Dashboard
1. Click to create a NEW dashboard
2. Click to CHANGE the name of the dashboard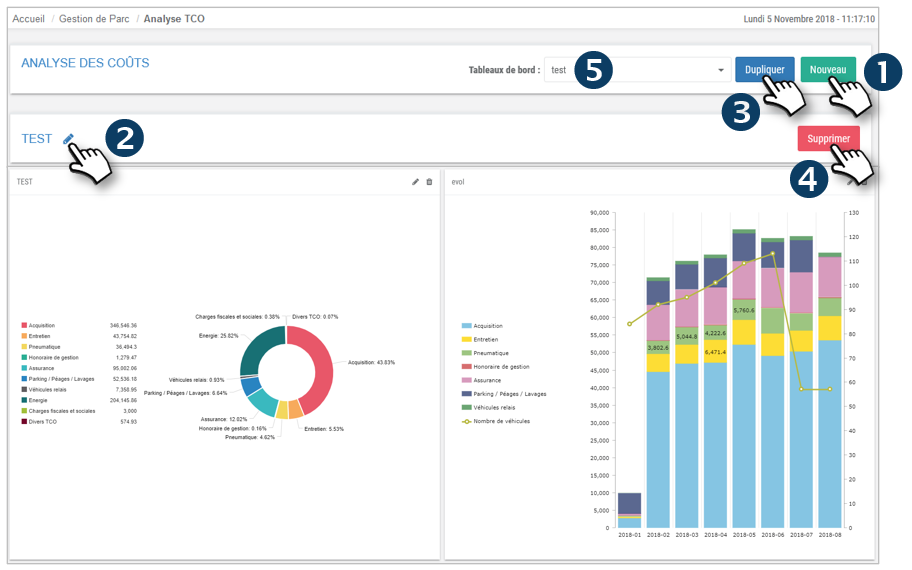
3. Click to DUPLICATE the dashboard if you want to create a very similar one and avoid recreating all the modules
4. Click to DELETE this dashboard
5. Select the dashboard you wish to display
Modules
6. Click to create a NEW analysis module
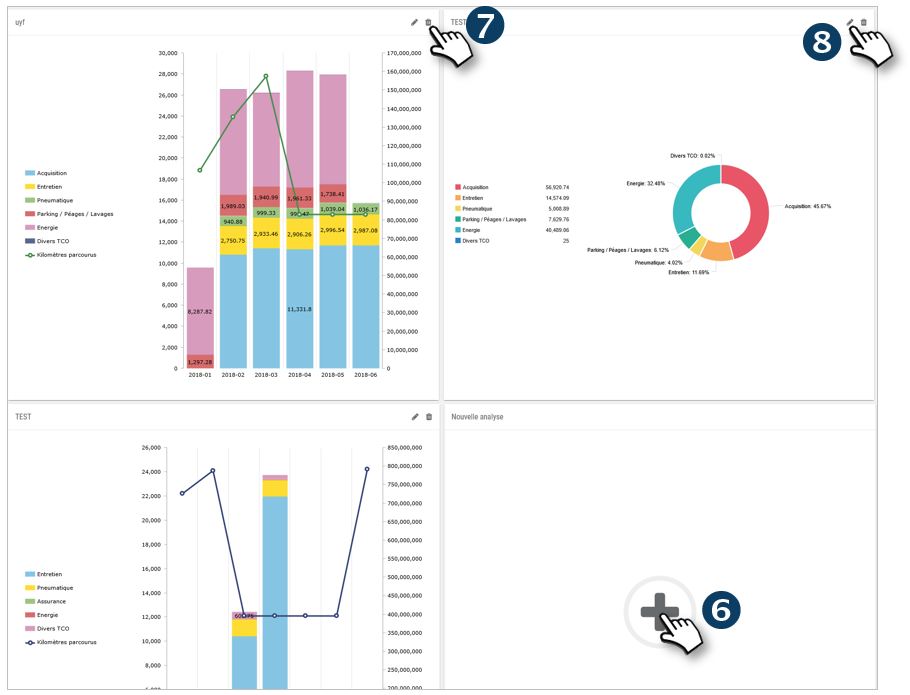
7. Click to DELETE this analysis module
8. Click to CHANGE the name of this analysis module
Create a TCO dashboard
Create
1. Click to create a NEW dashboard

2. Enter the name of the dashboard and click on CREATE
The dashboard appears in the list of saved dashboards
Modify the name of a dashboard
1. Select the dashboard from the list
2. Click on the icon  to CHANGE the name
 3. Saisissez le nom du tableau de bord et cliquez sur CRÉER

Duplicate a dashboard
1. Select the dashboard from the list
2. Click to UNFOLD this dashboard

3. The dashboard is duplicated with the name of the original dashboard + the suffix "- copy".
To change the name of the new dashboard see above
Delete a dashboard
1. Select the dashboard from the list

2. Click to DELETE
Create a graphical analysis module in the dashboard
Create a module
1. Click on + to open the criteria for the analysis module:
2. Enter the name of this module. This label will automatically become a template that you can reuse as a basis for another module to save time.
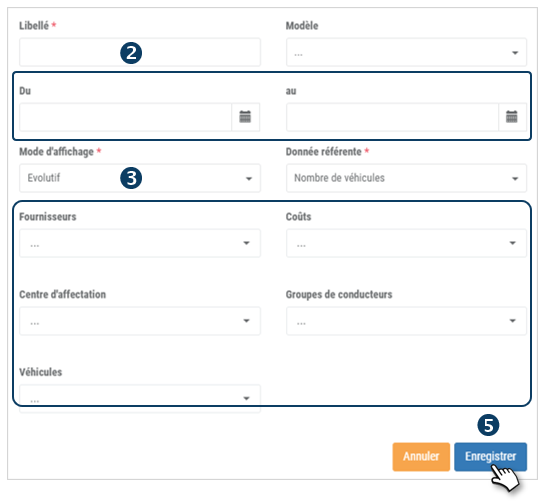
3. Select your criteria in all the fields and in particular the Display Mode which is mandatory:
- FLASH : instantaneous data
- EVOLUTIVE : evolution of the data over time. With this mode, the choice of another data is required: the referent data with 2 choices: "km traveled" or "nb of vehicles" which will be displayed as a curve
4. Select all criteria for the analysis
5. Do not forget to SAVE.
Edit a module
1. Click on the pictogram :
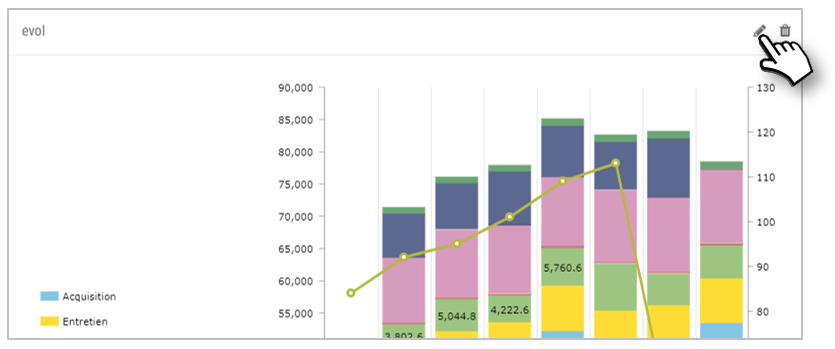
2. Modify the content of the module and click on SAVE
You can change the data display period for all the widgets.
This can be useful when you start a new year or a new period (quarter, half-year, etc.).
--> Click on the <pencil> icon, then on ‘Modify the period for all widgets’ and select the desired period. Confirm.
The period will be updated on all widgets.

Duplicate a module
1. Open the window for creating a module
2. Enter the name of this module and select the desired template and make the necessary adjustments to the content.
3. Click on SAVE
Remove a module
1. Click on the pictogram of the module to be DELETED
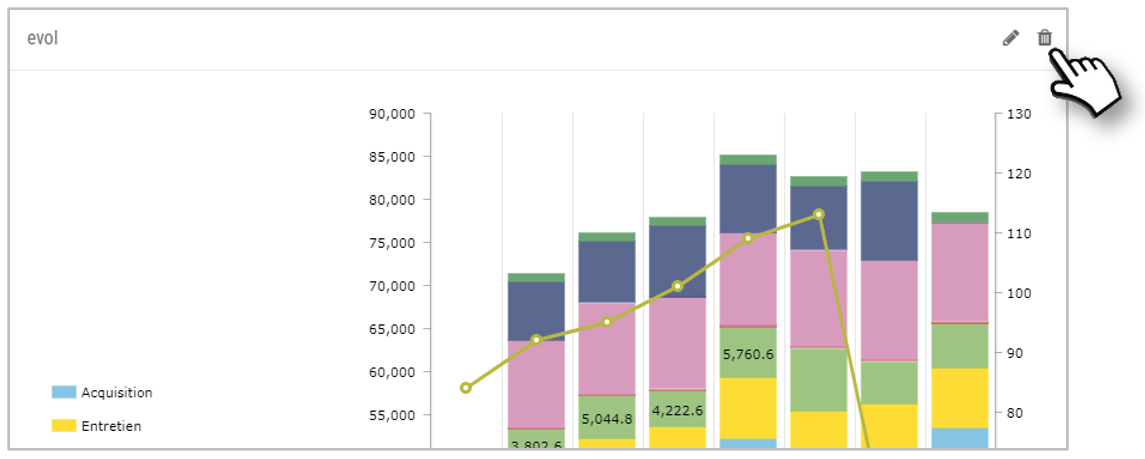
2. The module is removed from the dashboard
Cost price per kilometre (CPK)
The Cost per Kilometre is calculated from the TCO and therefore from the costs entered and/or imported into the platform
CPK = TCO / Vehicle mileage
The costs/TCO taken into account are all those that have been entered or imported into the platform.
The mileage taken into account is the one realized from the vehicle's SAVE on the platform.
The CPK is displayed on several pages:
If you have imported costs prior to the date of subscription to the platform, the CPK will be overestimated since the mileage retained is the one driven since the subscription.
Conversely, if you have entered only a part of the costs, your CPK will be underestimated.

