The routes
- 30 Jan 2025
- Print
- DarkLight
- Download PDF
The routes
- Updated on 30 Jan 2025
- Print
- DarkLight
- Download PDF
Article summary
Did you find this summary helpful?
Thank you for your feedback!
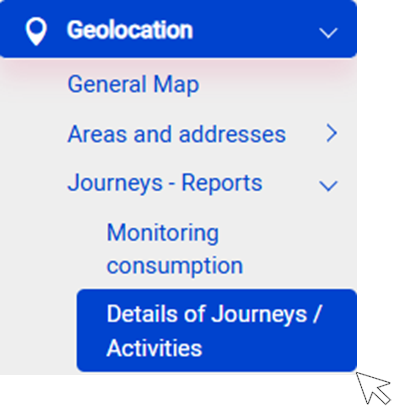
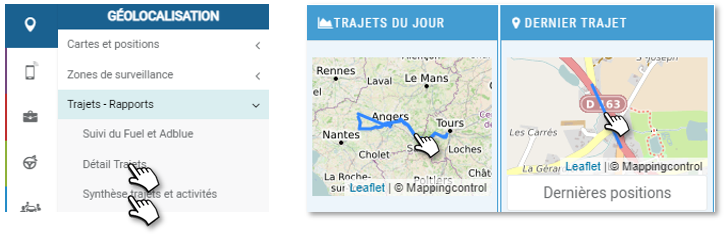
Consult all the routes of its fleet
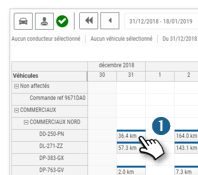
This screen displays the daily distance travelled by the vehicles in your fleet over the last 30 days.
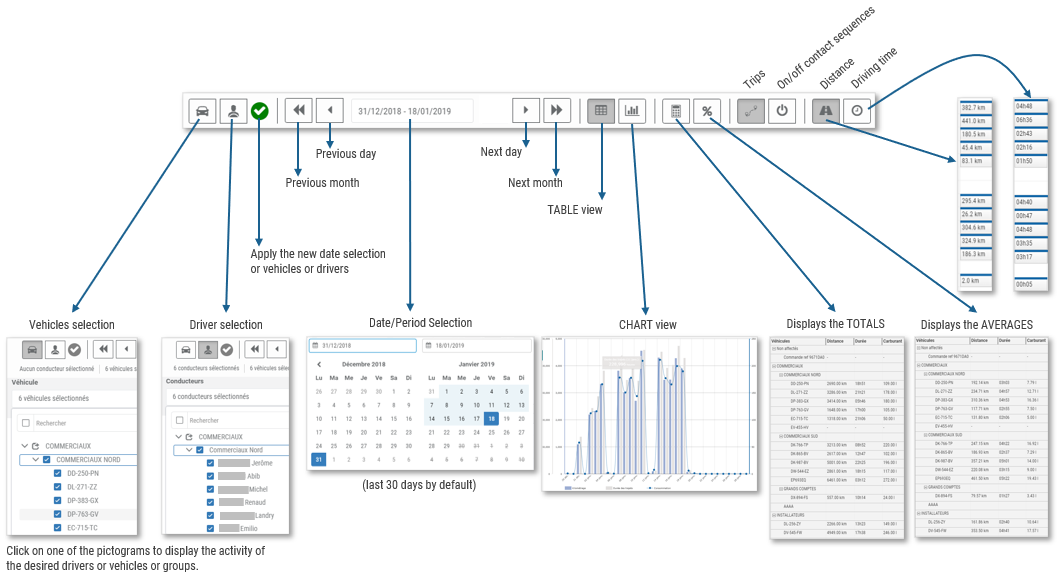
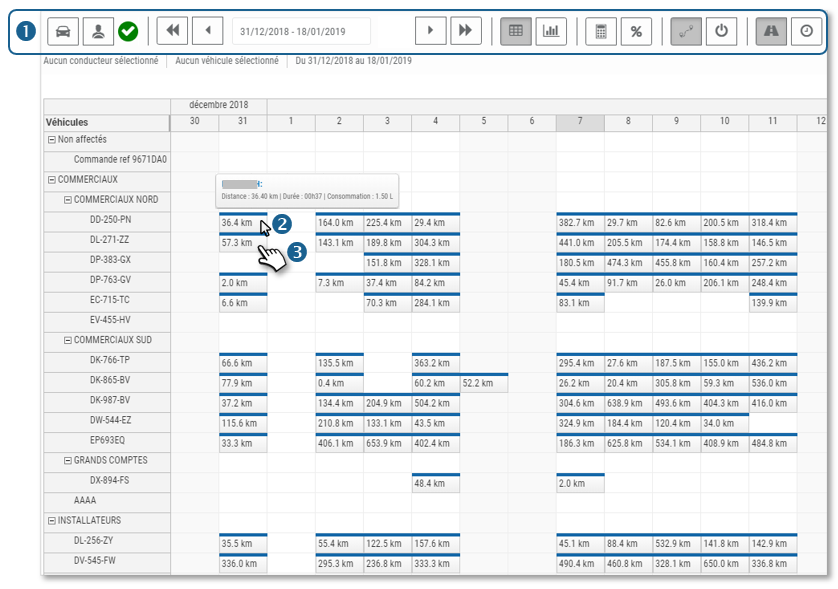 1. The tool ribbon allows you to display different views and options: period, trips, activities (on/off contact sequences), statistics, driver filters, vehicles...
2. When you move your cursor over a day of a vehicle, a tooltip displays the distance travelled, the driving time and the theoretical consumption.
3. If you click on this day, a window opens with the details of the journeys for this day.
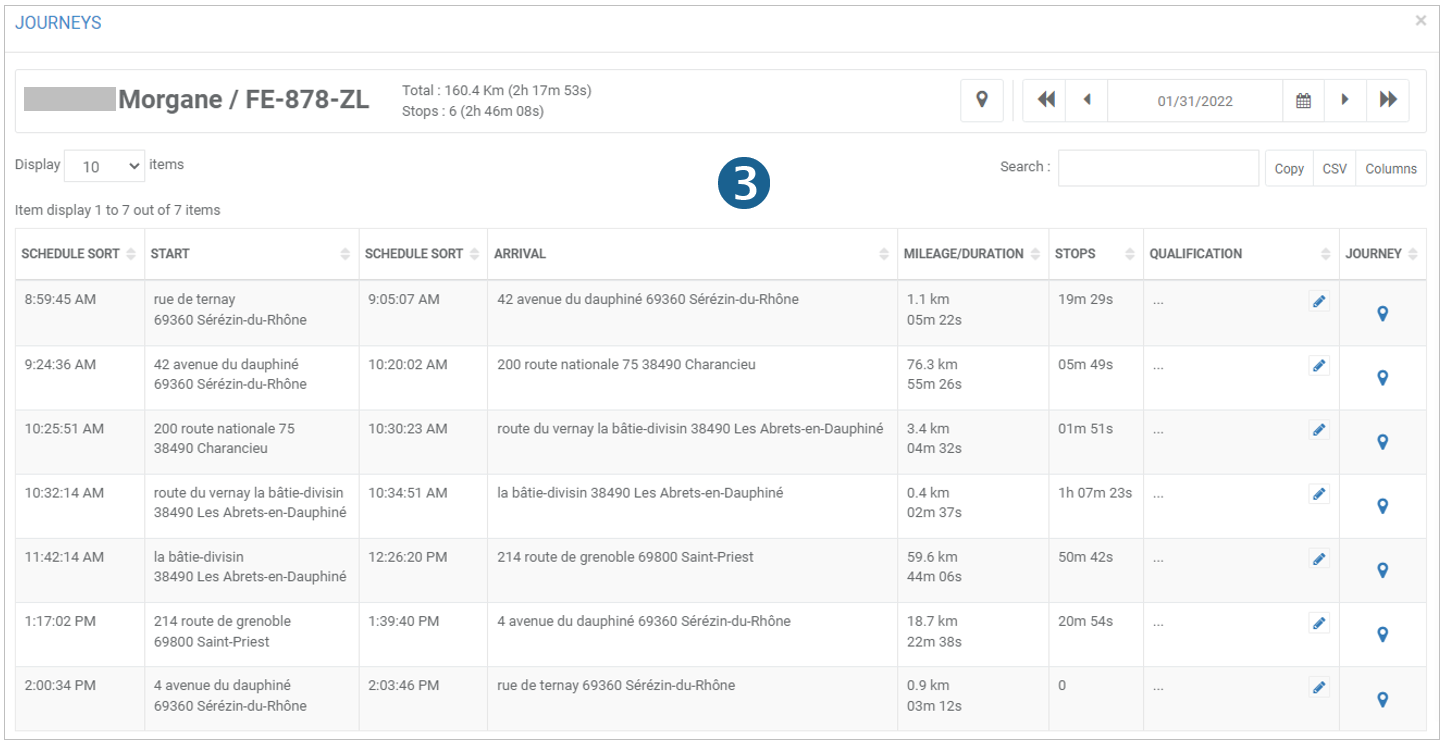
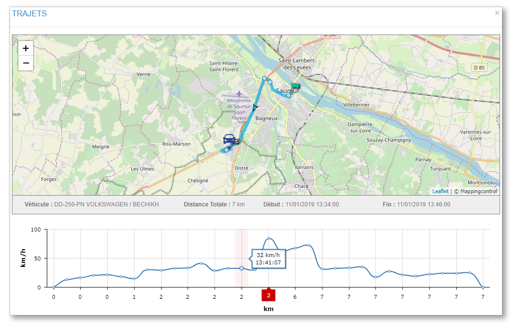
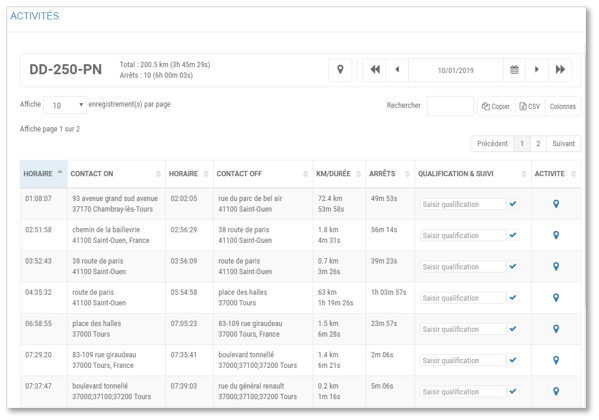
View route details
1. Click on the summary of the day in question.
2. A window is displayed with the details of all trips for that day.
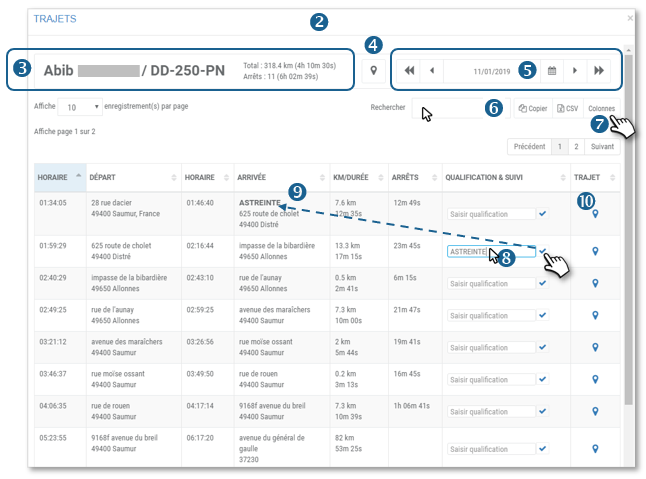
3. The top banner summarises the total distance travelled and the driving time for the driver and the vehicle concerned.
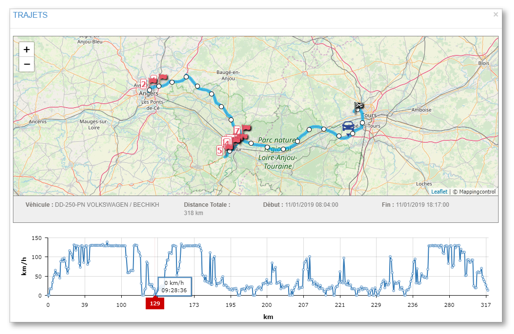
4. Click on to display all trips on a map with the speed curve point by point. (option available for 2 months in compliance with CNIL guidelines).
5. You can change the date if you wish.
6. You can search the table by keyword, copy the contents of the table or export it in .csv format.
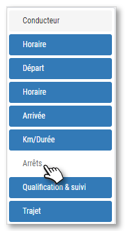
7. Click to customise the table display by hiding columns.
8. Enter a trip reason for a trip if you wish and confirm by clicking on
9. The pattern is SAVED and appears in the HOME column.
10. Click on  to display the route on a map with the speed curve point by point. (option available for 2 months in compliance with CNIL guidelines)
Display trip and activity summaries
This screen allows you to display the list of trips and activities for :
- 1 vehicle on a date or period
- Several vehicles for 1 specific date.
1. Click on the desired option, select your vehicle(s), your period/date and click APPLY.
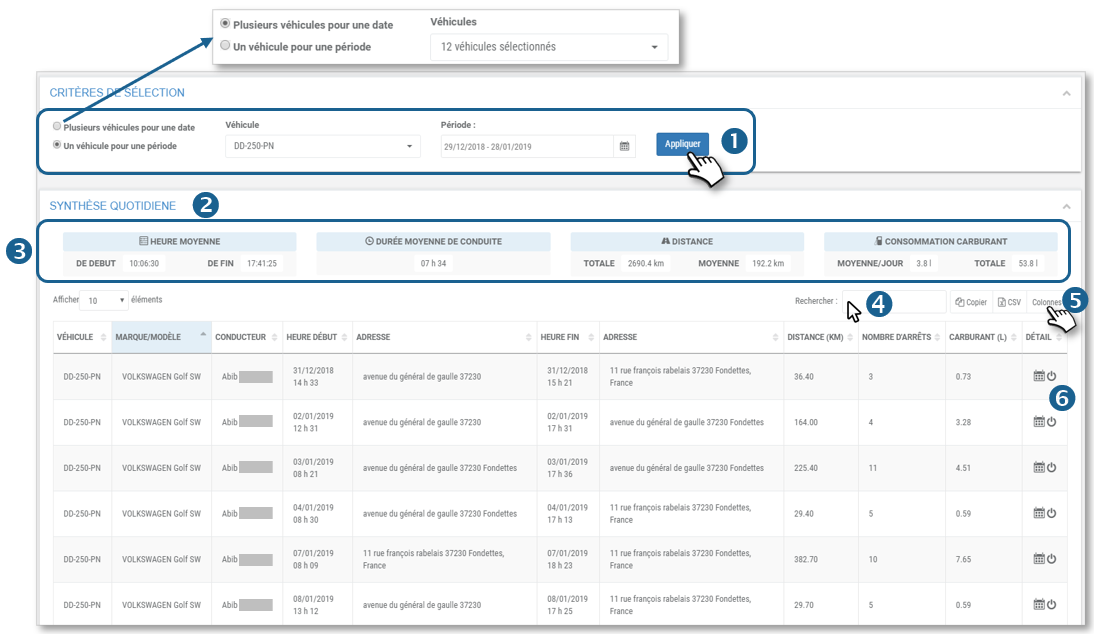
2. A list is displayed with details of all trips and activities.
3. The banner shows statistics on the listed trips.
4. You can search the table by keyword, copy the contents of the table or export it in .csv format.
5. Click to customise the table display by hiding columns.
6. Click on the icon  to display the details of the TRAFFIC.
Click on the icon  to display the ACTIVITY details (on/off contact sequences).
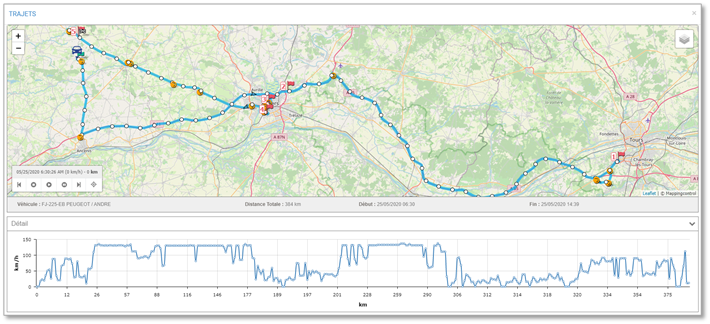
As seen above, you can enter a travel pattern for a trip and display the trip on a map with the speed curve point by point.
View eco-driving events
The eco-driving service must have been subscribed and activated beforehand
When you display the route of one or more trips on the map, the events are marked with the following icons:
 Sharp turn
 Heavy braking
 Violent acceleration
These events only appear if you have :
- subscribed to the eco-driving service
- activated eco-driving for these drivers
- activated geolocation for these vehicles
Display activity time
This screen allows you to display the sequence of on/off contacts and engine stops on a selection of vehicles for 1 day.
This allows you to see at a glance the time slots used and the degree of use of the vehicle.
It also allows you to see when the vehicle is stopped with the engine running, thus consuming fuel unnecessarily.
1. Select your vehicle(s) or group(s) and the date and click OK.
2. The activity map is displayed.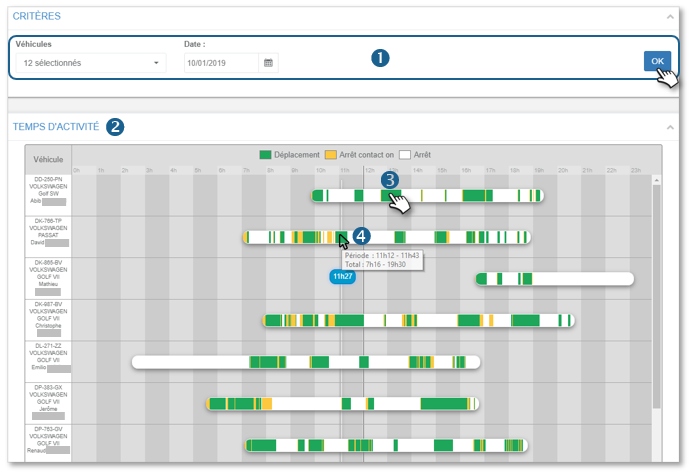
3. Click on a GREEN period (activity) to see the details of the on/off sequences (more precise than the trips). The options available from this window are the same as those seen previously.
4. Hover your cursor over a coloured period to display a tooltip detailing the period on the day's total activity.
Fuel and AdBlue monitoring
This screen allows you to display the fuel and AdBlue level of 1 vehicle from 1 to 30 days maximum.
1. Select the vehicle.
2. Select the date or period concerned (30 days max)
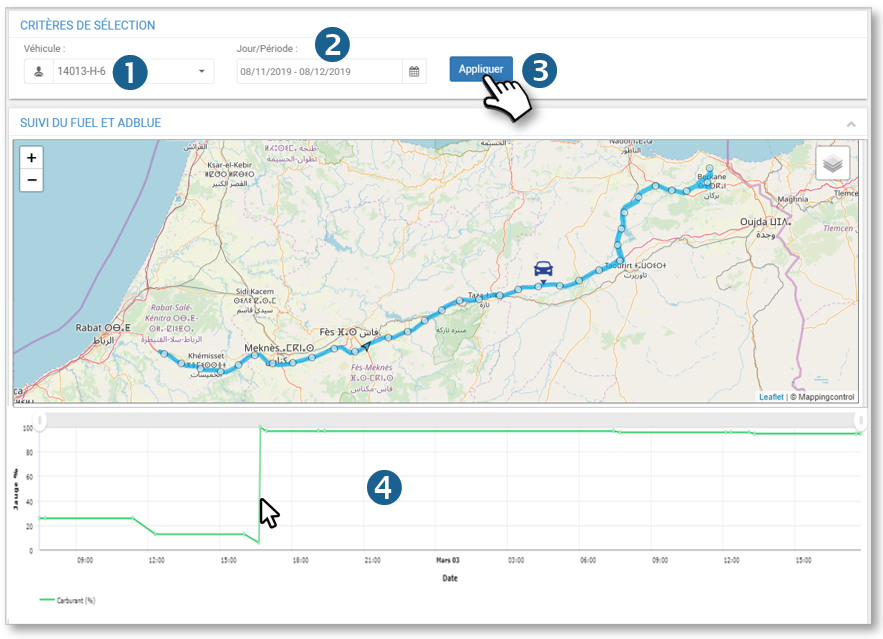
3. Click on APPLY.
4. The routes are displayed on the map with the fuel level rise points and the fuel and AdBlue level curve.
Move the cursor over the graph to see the details of the data and the position on the map.
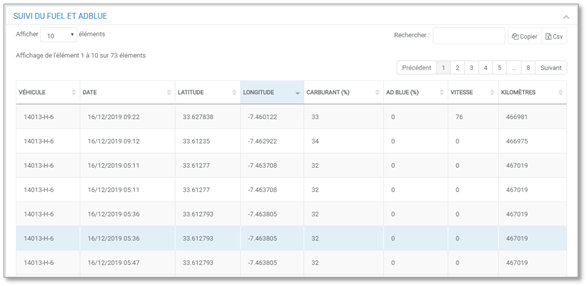
5. The table details the positions and levels.
Tracking can only be displayed for a maximum of 30 days
Was this article helpful?