History of events
- 15 Feb 2023
- Print
- DarkLight
- Download PDF
History of events
- Updated on 15 Feb 2023
- Print
- DarkLight
- Download PDF
Article summary
Did you find this summary helpful?
Thank you for your feedback!
Access the list of vehicle boxes

ATTENTION: This is not your vehicle fleet
This can be viewed in the FLEET MANAGEMENT tab:
This is a list of your telematics boxes, their connection status and the vehicles in which they are (or have been) installed or even removed.
In the case of an installed and then removed enclosure :
- No driver is mentioned.
- The vehicle(s) that inherited the box is/are mentioned with the name of the driver being assigned.
In the case of a box that has been serviced or replaced, it is normal for a vehicle to appear with two boxes: the previous one (serviced) and the new one (current).
By default the list of ALL enclosures is displayed.
1. You can filter the list display according to several criteria and then click on DISPLAY.
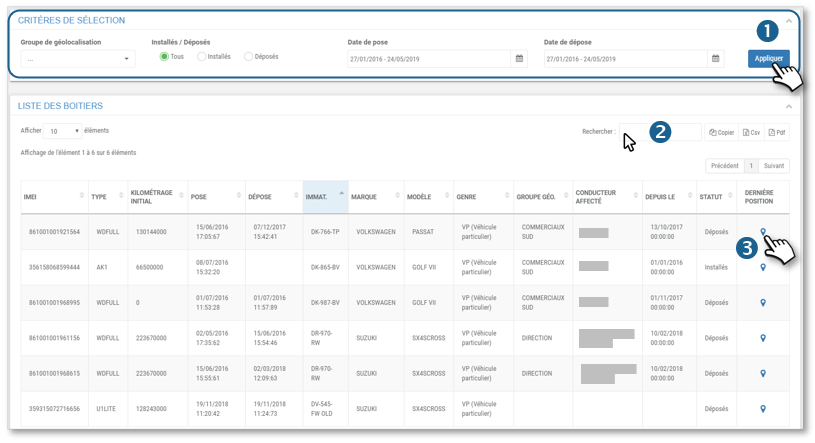
2. You can search the table by keyword, copy the contents of the table or export it in .csv format.
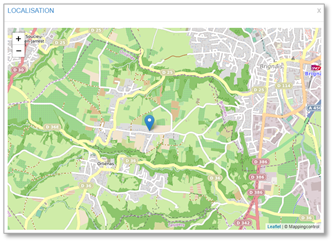
3. Click on  to see the location of the last known position of the enclosure
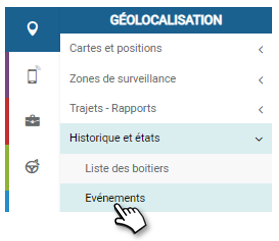
Accessing vehicle-generated event alerts
This screen automatically displays ALL alerts of all types over the last 30 days by default.
1. However, you can select one or more vehicles or groups, filter by alert type and time period, and then click APPLY to display only the relevant alerts.
2. The list of alerts is displayed, sorted by vehicle, with the type of alert, the date and time of the alert, the address, the GPS coordinates and access to the map.

3. You can search the table by keyword, copy the contents of the table or export it in .csv format.
4. Click on the icon  to display the location of the alert on a map

Accessing fault alerts (CAN boxes)
All fault codes generated by your vehicles
This screen automatically displays, by default, ALL fault code alerts* for ALL vehicles over the last 30 days.
1. However, you can select one or more vehicles or groups, filter on a period, then click APPLY to display only the alerts concerned.
2. The list of alerts is displayed, sorted by date, with the vehicle, drivers, fault type, fault name and fault code and status.
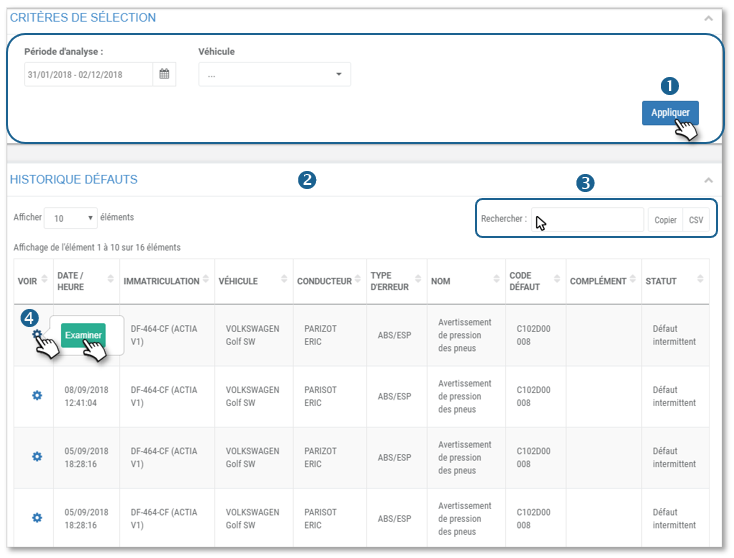
3. You can search by keyword in the table, copy the contents of the table, or export in .csv format.
4. Click on the icon  and then EXAMINE to display the available data* of the vehicle:
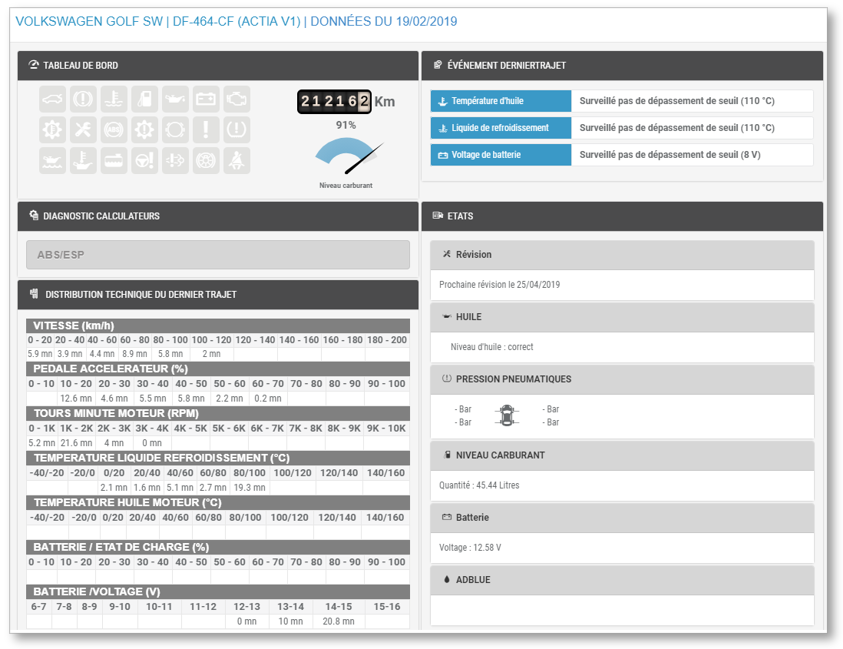
* Listed and reassembled by the electronic box.
Some codes may not be accessible because they are blocked by the manufacturers.
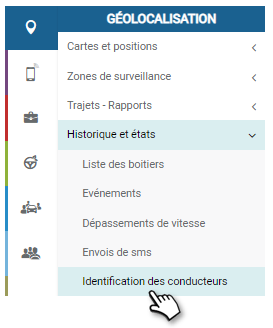
Driver identification
View all badge passes in vehicles
This screen automatically displays ALL IDs in ALL vehicles over the last 30 days, by default.
1. However, you can select a time period, vehicle(s) or group(s), driver(s) or group(s) and sort the display by driver or vehicle, then click APPLY to display only the relevant IDs.
2. The list of badge passes is displayed, sorted by driver by default (unless you have selected "by vehicle"), with the badge number, driver name, vehicle, estimated vehicle mileage and GPS coordinates and access to the map.
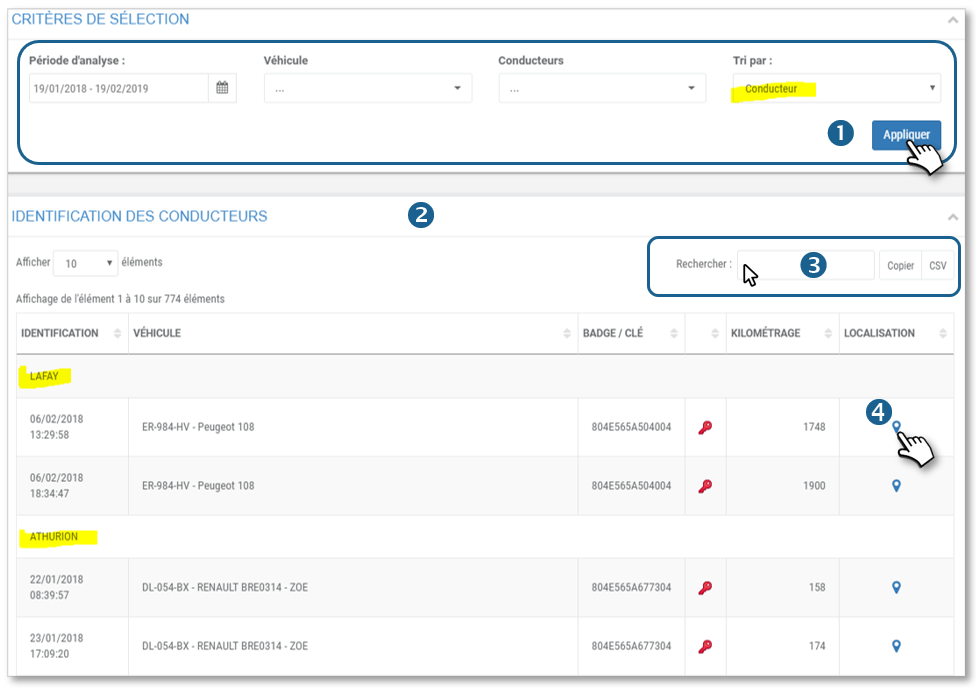
The colour of the key indicates the current status of the vehicle
3. You can search the table by keyword, copy the contents of the table or export it in .csv format.
4. Click on the icon to display the location of the identification on a map.

Displaying speeding

This screen automatically displays ALL overruns for ALL drivers/vehicles over the last 30 days, by default.
1. However, you can select a specific time period, vehicle(s) or group(s), driver(s) or group(s), filter with a specific speed, and then click APPLY to display only the relevant overruns.
2. The list of overtakings is displayed, sorted by vehicle, with driver name, date, address, GPS coordinates and access to the map.
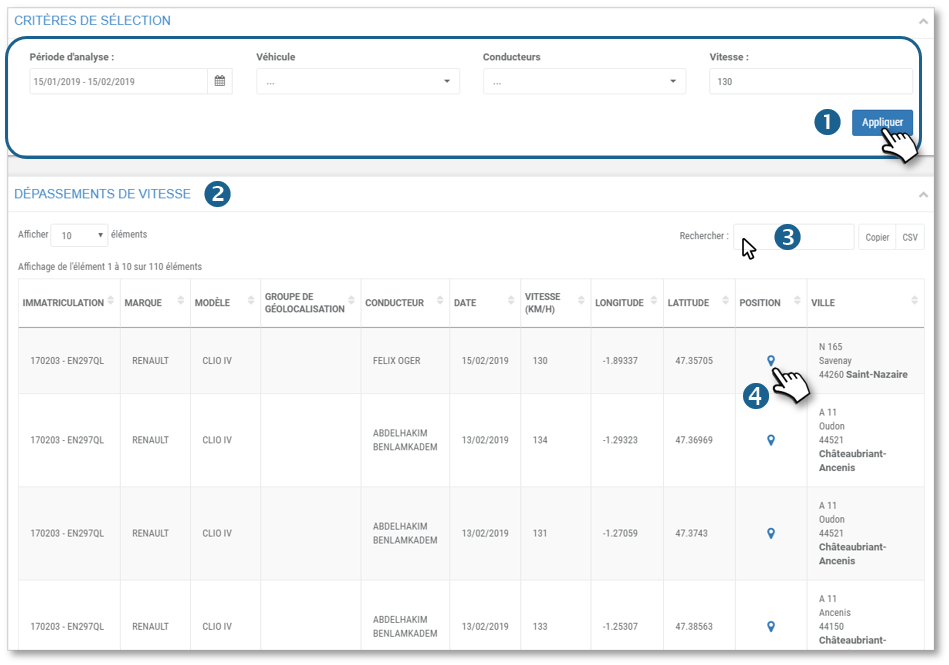
3. You can search the table by keyword, copy the contents of the table or export it in .csv format.
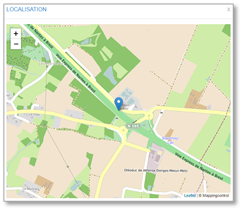
4. Click on the icon to display the location of the overrun on a map.
Display temperature overruns
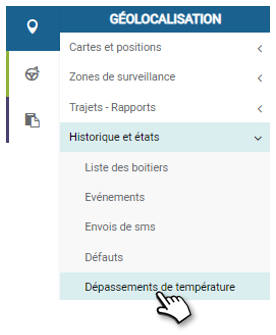
This screen allows you to display a list of temperature alerts over a given period. By default, ALL alerts for ALL vehicles over the last 30 days are displayed.
You can of course filter the display of alerts using 3 criteria:
1. Click to change the analysis period.
2. Click to select the desired vehicle(s).
3. Click to filter the alerts: all, below threshold or above.
4. Click the APPLY button to display the result in the table below.

5. You can search the list by keyword.
6. You can copy the contents of the table and paste it into another document.
7. You can export the contents of the table in .csv format.
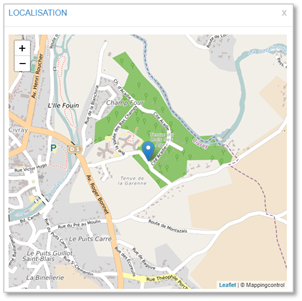
8. Click to display the alert point on the map.
Accessing messages
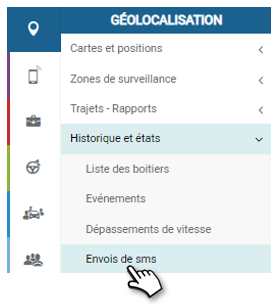
This screen automatically displays ALL messages sent in the last 30 days, by default.
1. However, you can select a time period and driver(s) and click APPLY to display only the relevant messages.
2. The list of messages is displayed, sorted by driver, with date and message.

3. You can search the table by keyword, copy the contents of the table or export it in .csv format.
Was this article helpful?